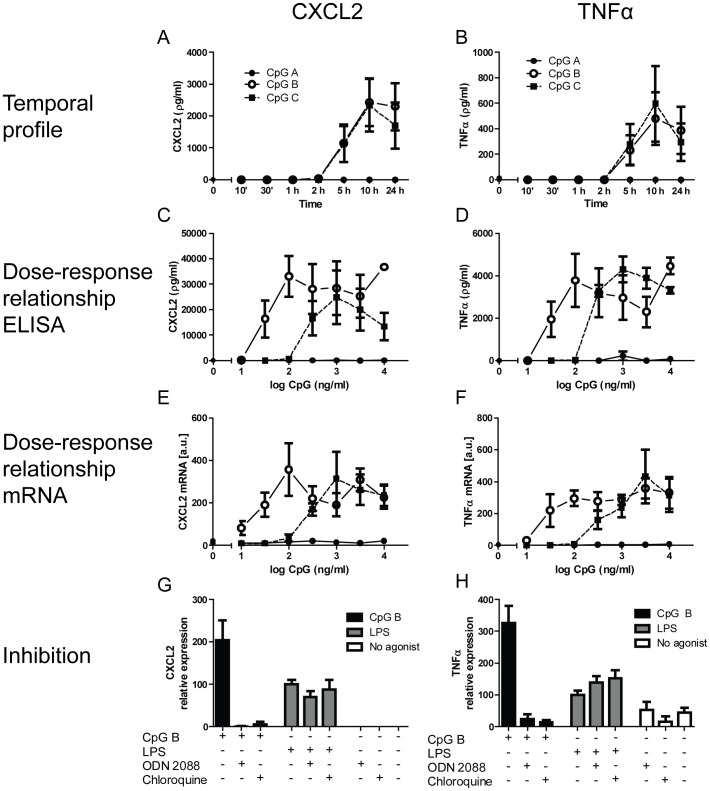
Figure 1. TLR9-stimulated responses in cardiac fibroblasts.
Temporal profiles (10 min, 30 min, 1 h, 2 h, 5 h, 10 h and 24 h) of (all at 100 ng/ml) CpG A (dots), CpG B (open circles) or CpG C (squares)-stimulated release of CXCL2 (panel A) and TNFα (panel B) in murine cardiac fibroblasts (CF). Each data point represents the mean ± SEM of 3 separate experiments. Dose-response relationships of CpG A (dots), CpG B (open circles) and CpG C (squares) –stimulated release of CXCL2 (panel C) and TNFα (panel D) at 18 hours. Each data point represents the mean ± SEM of 6 experiments. Expression levels of CXCL2 (panel E) and TNFα (panel F) were analyzed by qPCR. Each data point represents the mean ± SEM of 4 experiments. TLR9 specificity studies were performed on murine CFs exposed to CpG B (100 ng/ml) or LPS (10 ng/ml) with or without the presence of ODN 2088 (10 µg/ml) or chloroquine diphosphate (5 µg/ml). Levels of CXCL2 (panel G) and TNFα (panel H) were analyzed after 18 hours. Each data point represents the mean ± SEM of 3 experiments.

