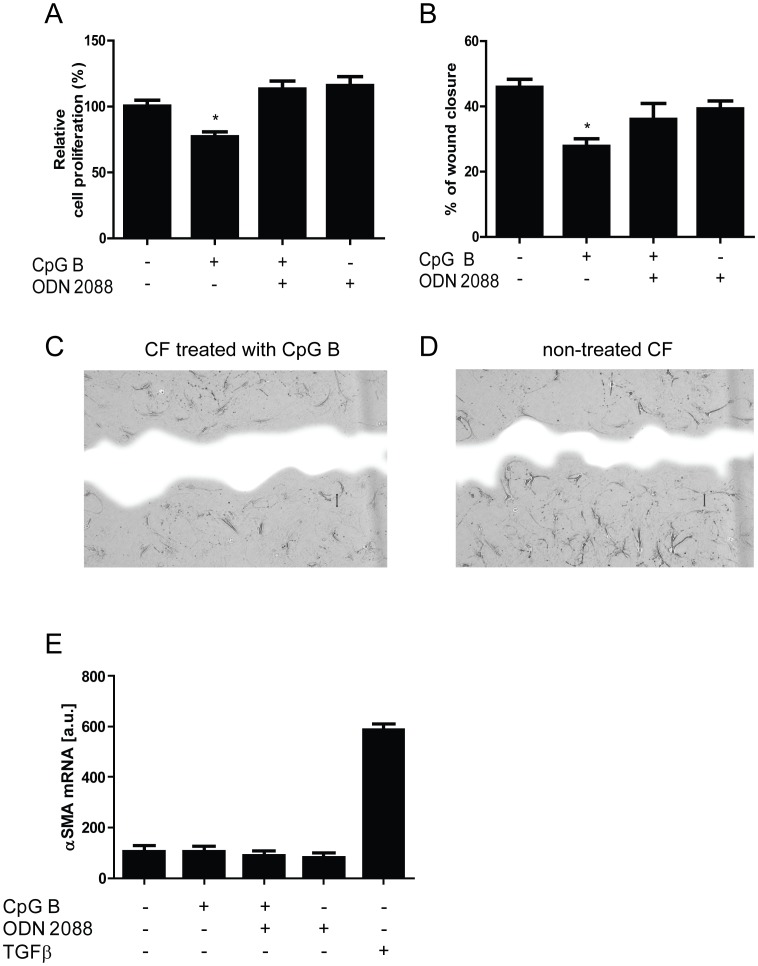
Figure 4. Functional analysis of TLR9-stimulated responses in cardiac fibroblasts.
Proliferation by BrdU-incorporation (panel A, n = 4) and proliferation/migration by scrape wound assays (panel B n = 4) were examined in murine cardiac fibroblasts (CFs). Data are presented as mean ± SEM. *p<0.05 vs. control, **p<0.01 vs. control. Panel C and D - representative photographs of CFs proliferation/migratory responses on (100 ng/ml) CpG B stimulation (panel C) and vehicle (panel D) in scrape wound assay 18 hours after cell distortion. Blue color represents wound area. Differentiation in response to CpG B (100 ng/ml) and/or ODN 2088 (1 µg/ml) was examined in murine CFs (panel E, n = 7). TGFβ (2.5 ng/ml) serves as positive control. Data are presented as mean ± SEM.

