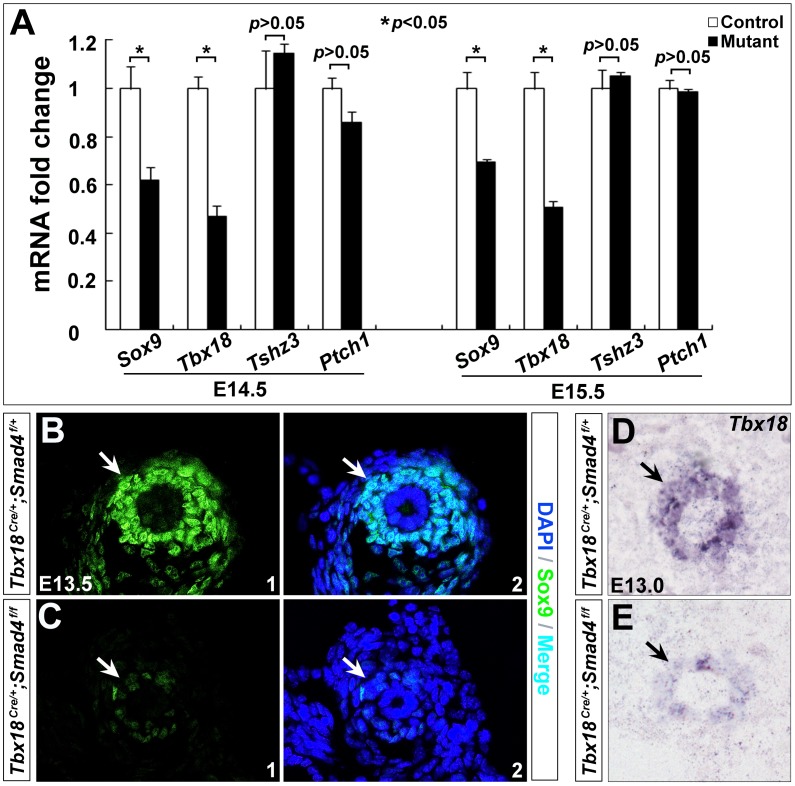
Figure 6. Reduced Sox9 and Tbx18 expression in Smad4CKO ureters.
(A) qRT-PCR was performed to determine expression of Sox9, Tbx18, Tshz3 and Ptch1. (B,C) Immunostaining of Sox9 in control (B) and mutant embryos (C) at E13.5. (D,E) RNA in situ hybridization of Tbx18 in the control (D) and mutant embryos (E) at E13.0, respectively. Arrows indicate positive staining of cells in the controls with corresponding regions in the mutants.

