
Figure 1. Confocal micrographs of Tau-stably expressed HEK-293 cells immunostained using PHF-1 and Tau-5 antibodies.
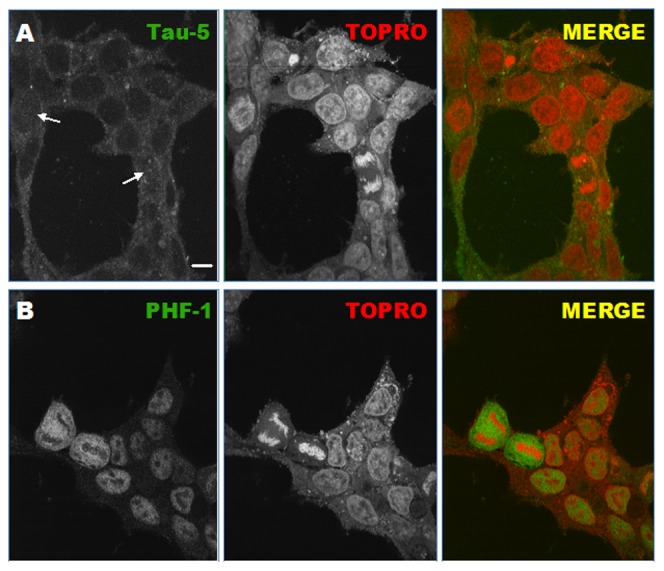
Left column (green in grey scale) corresponds to Tau-5 (A, total Tau) and PHF-1 (B, phosphorylated Tau). Central column (red in grey scale) shows To-Pro-3 labeling (DNA). Right column shows merge images. Scale bar is equal to 10 µm.