
Figure 4. Equilibrium binding of Tau protein to DNA immobilized on the sensor surface.
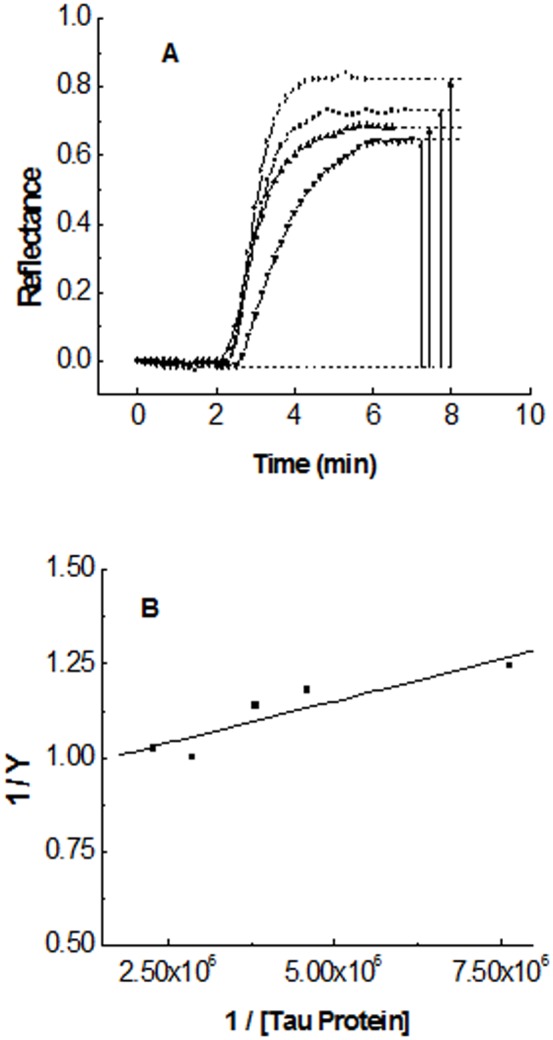
Part A: Reflectance time-course after flowing Tau protein solutions at different concentrations in µg/mL: 16 (•), 12 (▪), 10 (▴), 6 (▾). Part B: inverse plot of the concentration dependency of the fractional saturation (equation [10]).