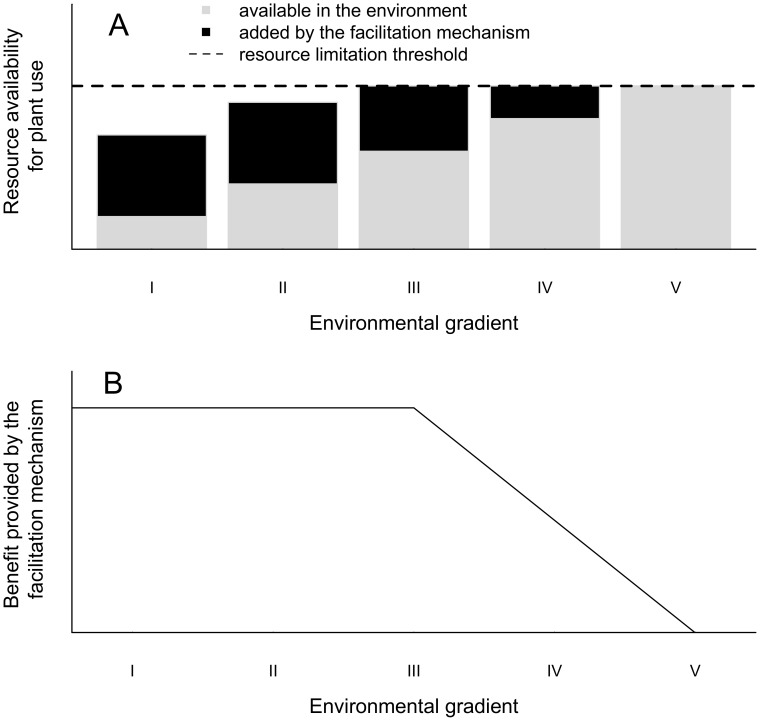
Figure 4. A graphical model of the stress gradient hypothesis regarding facilitation mechanism, which shows how a constant facilitation effect can occur along an environmental gradient.
A) A gradient is defined by the monotonic variation in the availability of a resource (gray bars), which increases by a constant amount due to a plant facilitation mechanism (black bars). The dashed line represents the resource limitation threshold: below this line, the resource is limiting, and above this line, the resource is not limiting. B) The relationship between the environmental gradient (as described for graph A) and the benefits provided by the additive facilitation effect. Note that in the region of the gradient where the resource is limiting (levels I and II in graph A), the benefits provided by the facilitator are constant along the environmental gradient (levels I and II in the graph B). However, from the point where the total availability of the resource (from the environment and the facilitator) reaches the resource limitation threshold (gradient level III), further increases in the resource availability along the gradient will reduce the portion of the resource used by the plant that is provided by the facilitator. As a consequence, in this region of the gradient (levels III–V), the benefits provided by the facilitator wane as the stress is reduced.

