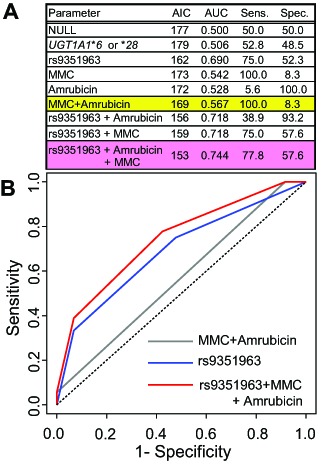
Figure 4. Comparison of AIC, AUC, and ROC curves for logistic regression models.

(A) Parameters of each model. (B) The ROC curve of a model consisting of rs9351963+MMC+ Amrubicin. ROC: receiver operating characteristic, AUC: area under the ROC curve, NULL indicates the model without parameters. Each genetic factor conforms to the proportional odds model, AIC: Akaike's information criterion, AUC: area under the ROC curve, Sens.: Sensitivity (%), Spec.: Specificity (%).
