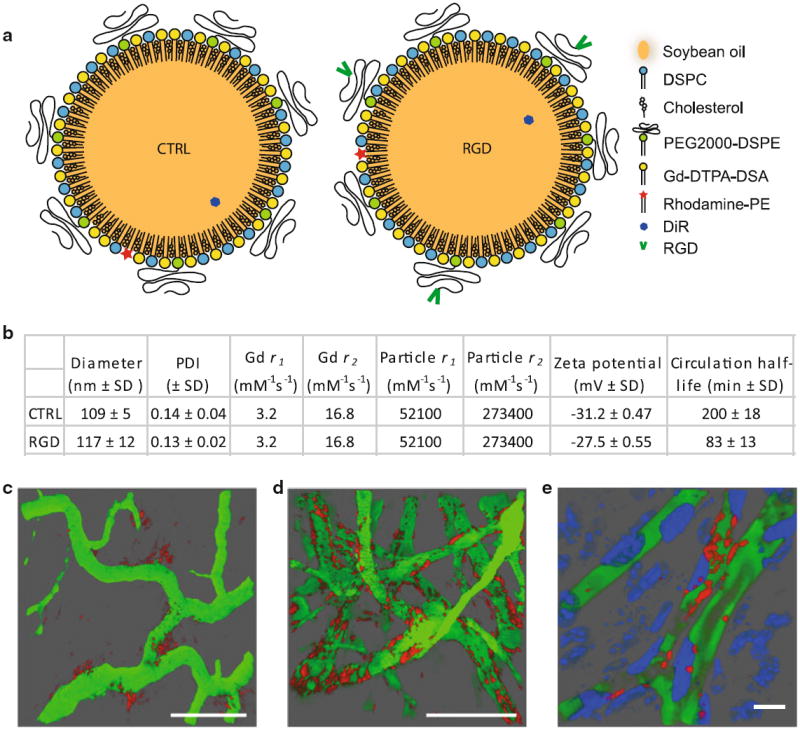
Fig. 1.

Nanoemulsion characteristics. a Nanoemulsion cartoon with legend. b Nanoemulsion characteristics. Relaxivities were measured at 7T and room temperature. SD standard deviation. c–e IVM of the tumor vasculature (green) 8 h post injection of CTRL nanoemulsion (red) (c), 2 h post injection of RGD nanoemulsion (red) (d), and 3 h post injection of RGD nanoemulsion (red) (e). In e cell nuclei were labeled with an intravenous injection of Hoechst (blue). The scale bars in c and d represent 100 μm and in e 10 μm. c, d Were reprinted (adapted) with permission from [27]. Copyright (2012) American Chemical Society
