
Fig. 5.
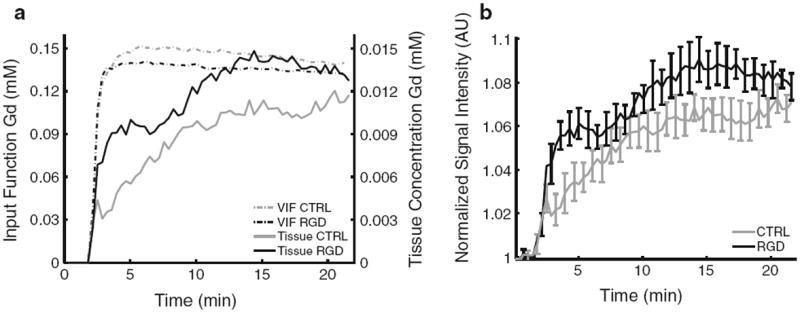
DCE-MRI data. a Overlay of the average vascular input functions (dotted lines, scaling to the left y axis) and the average Gd concentration in the tumor rim (continuous lines, scaling to the y axis on the right). b Averaged normalized signal intensity in the tumor rim plotted as a function of time.Error bars represent the standard error of the mean and for both CTRL and RGD n = 4