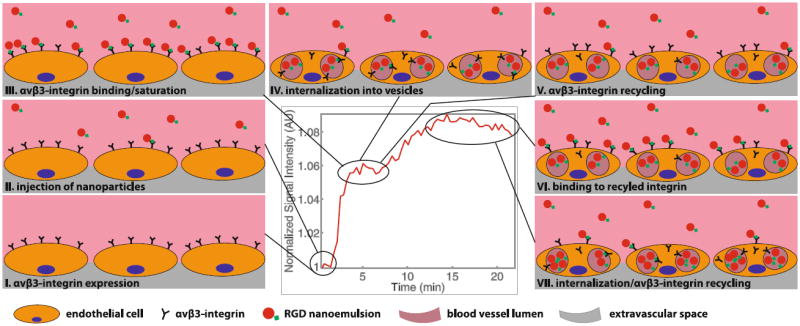
Fig. 9.

Graphical representation of the hypothesized chronological events leading to the observed periodicity. I, II Show the situation before and just after injection. III Depicts the binding/saturation which leads to the first signal increase. IV Shows the internalization during the first interval where no signal increase is observed and V shows the recycling of integrin back to the cell membrane which is occurring towards the end of the first interval with constant signal intensity. VI Shows the binding which has occurred after the second signal increase and VII shows internalization/recycling occurring again towards the end of the measurement
