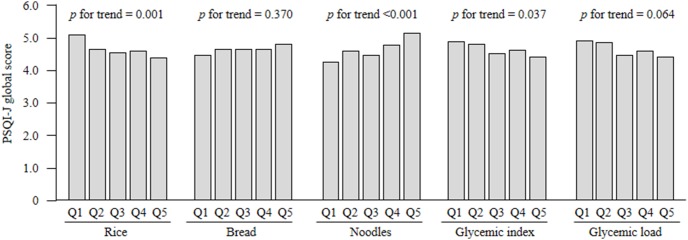
Figure 1. PSQI-J global scores for quintiles of starchy food intake, dietary glycemic index, and glycemic load.

Mean PSQI-J global scores were adjusted for age, sex, and total energy intake (kcal/day, continuous), by using the analysis of covariance model. PSQI-J: Japanese version of the Pittsburgh Quality Index; Q: quintile.
