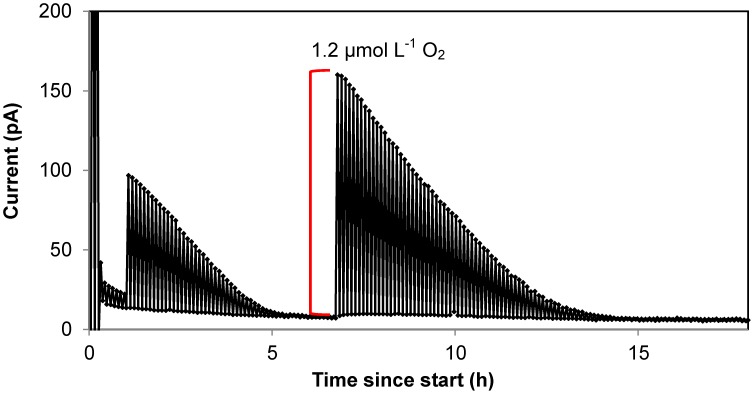
Figure 3. Time course of oxygen depletion in a STOX sensor incubation with coastal seawater.
Example of STOX sensor data from incubation of water from Station 2 (Marselisborg Marina, September 2011). Only minimum and maximum readings during each cycle are plotted and connected with lines. The difference between maximum and minimum readings is used as a measure of the O2 concentration. The initial amplitude of the signal (11 pA) corresponds to an O2 concentration in the bottle of 200 nmol L−1. Injections of air saturated water were made at 1 h (2 mL, ∼600 nmol L−1), and at 6.7 h (4 mL, ∼1200 nmol L−1), as showed by the red line.

