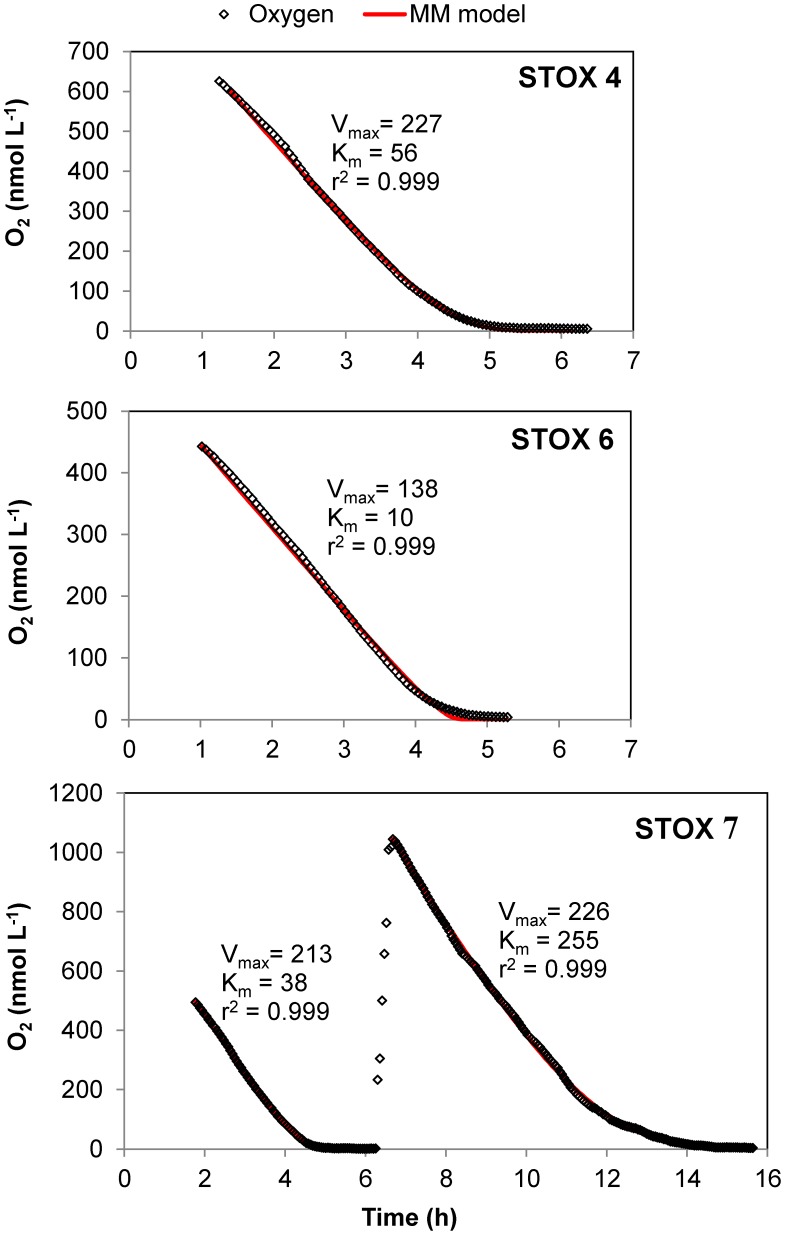
Figure 5. Examples of modeling of oxygen depletion curves in coastal seawater samples.
Oxygen depletion experiments from three incubation bottles (4, 6, 7) from St. 2 (Marselisborg Marina), September 2011. Air saturated water was injected in bottle “STOX 7” once O2 was depleted (6 h). The dots show O2 values recorded by the STOX sensor. Maximum rates (Vmax) and half saturation constants (Km) were determined by least squares fits (red solid line) using Eq. (2), derived from Michaelis-Menten kinetics. The method gave a relatively poor fit that might result in an underestimation of the Km value for the “STOX 6”.

