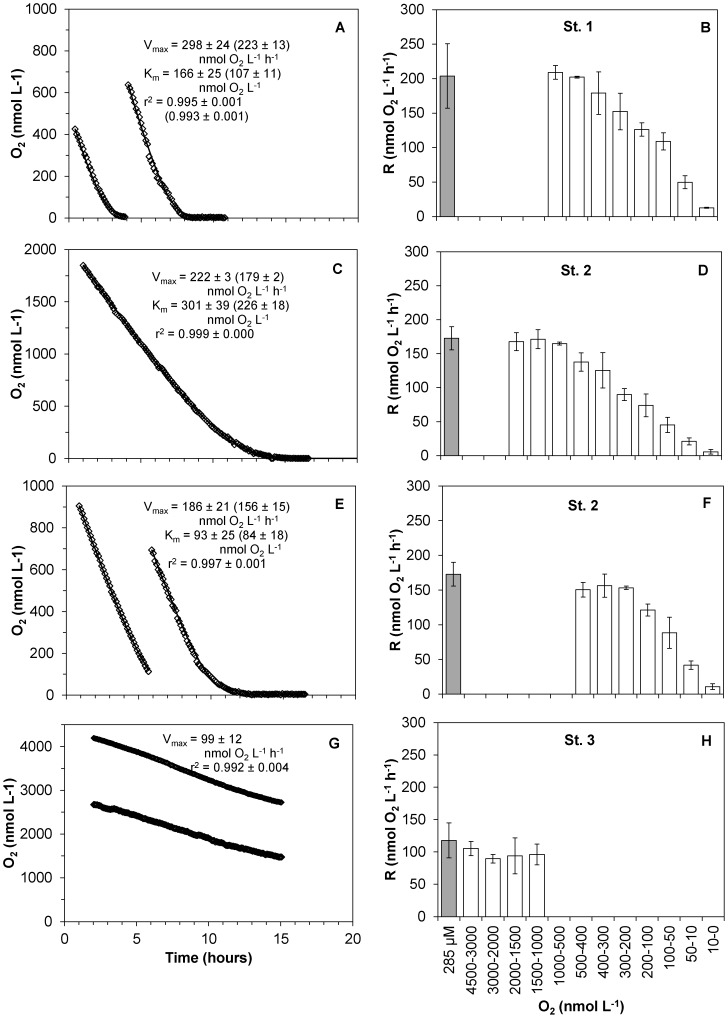
Figure 6. Comparison of CR rates measure with the STOX method and with Winkler titrations.
Time course of oxygen depletion during incubations (A, C, E, G) and respiration rates at different O2 concentrations (B, D, F, H) measured by the STOX method (from 0 to 2 µmol L−1, white bars), and by Winkler titrations (at air saturation, grey bars). A, B: St. 1 (Randers Fjord); C, D: St. 2 (Marselisborg Marina) at concentrations of 0–2 µmol L−1 and E, F: Marselisborg Marina at concentrations of 0–1 µmol L−1. G, H: St. 3 (Hanstholm). Rates are averages ± standard error (n = 3). Both Michaelis-Menten kinetic parameters and Jassby and Platt ones (in parenthesis) are presented.

