
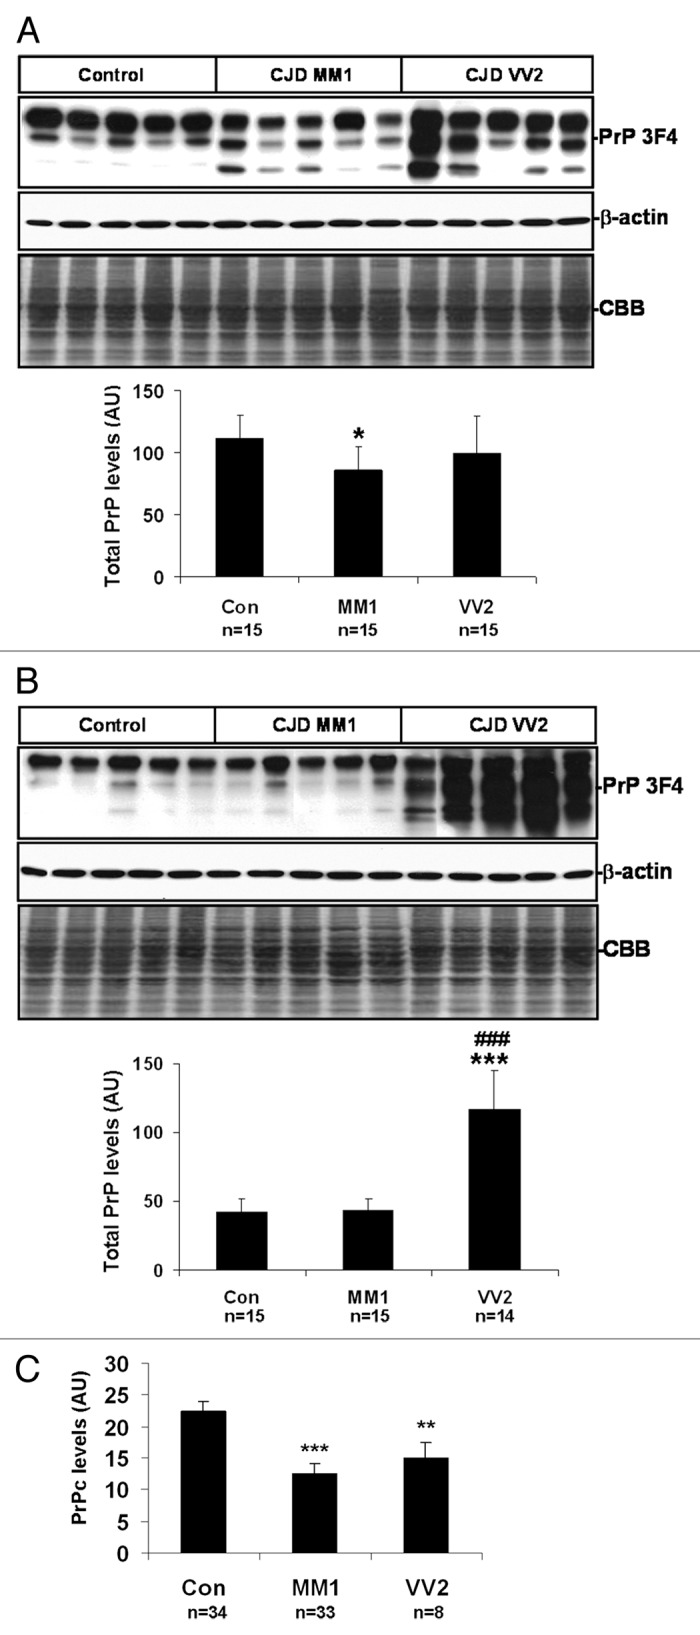
Figure 2. PrP protein expression in sCJD brain and CSF samples. (A) western blot analysis of PrP using the PrP antibody 3F4 in the frontal cortex of control, sCJD MM1 and sCJD VV2 cases represented by five cases per condition and using β-actin immunostaining and Coomassie Blue to normalize total protein loading are shown in the upper panel. Densiometric values of all the cases analyzed by western blot: control (n = 15), sCJD MM1 (n = 15), sCJD VV2 (n = 15) show significant decrease of total PrP in MM1 cases (lower panel). (B) western blot analysis of PrP using the PrP antibody 3F4 in the cerebellum of control, sCJD MM1 and sCJD VV2 cases represented by five cases per condition are shown in the upper panel. β-actin immunostaining and Coomassie-Blue were used to normalize total protein loaded into the gel. Densiometric assessment of all the cases analyzed by western blot: control (n = 15), sCJD MM1 (n = 15), sCJD VV2 (n = 14) reveals a marked increase in PrP protein expression levels in the cerebellum of VV2 (lower panel). Note the presence of the lower band of 20 kDa or 19 kDa only in sCJD cases. (C) ELISA analysis using Platelia BSE-Detection Kit (Bio-Rad Laboratories GmbH) of PrPc levels in the CSF of control (Con), sCJD MM1 and sCJD VV2. *P > 0.05; *P > 0.005; ***P > 0.001: control vs sCJD, ###P > 0.001: sCJD MM1 vs VV2. AU: arbitrary units.