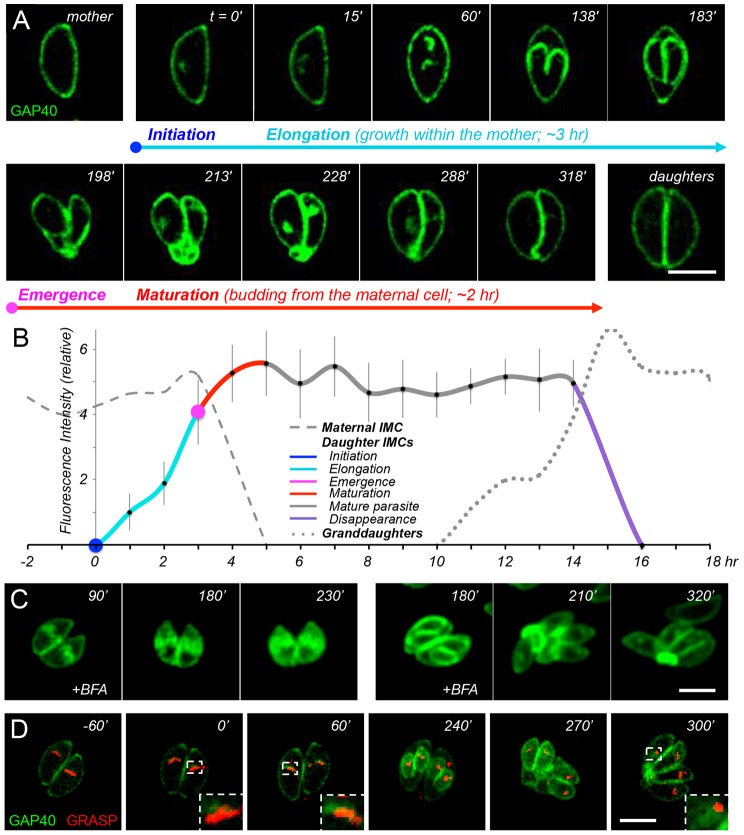
Fig. 2.
Time-lapse imaging and quantitative dynamics of GAP40. (A) Time-lapse imaging of GAP40–YFP-expressing transgenic parasites (C-terminally tagged at the endogenous genomic locus); see supplementary material Movie 1 for additional images. (B) Quantification of GAP40 fluorescence in mother, daughter and grand-daughter parasites (dashed, solid and dotted lines, respectively), determined from 14 sets of time-lapse images aligned according to the estimated time of daughter parasite initiation. The results of a sliding window analysis of 1-h bins are presented as the mean±s.d. (n = 6–24 samples; see supplementary material Fig. S2 and Table S1). Color coding indicates IMC initiation (blue), elongation (aqua), emergence (magenta) and maturation (red), as well as interphase parasites (gray) and IMC disappearance (purple). (C) The addition of BFA (5 µg/ml) at 90 min (left) or 180 min (right) after daughter parasite initiation arrests further development of the IMC; see text for discussion. (D) Time-lapse colocalization of GAP40–YFP (green) in transgenic parasites expressing the Golgi marker GRASP–mRFP (red) reveals that assembly initiates close to (but is distinct from) the Golgi (see supplementary material Movie 2 for additional images). The area enclosed by the dashed white line is enlarged in the lower right corner. Scale bars: 5 µm.

