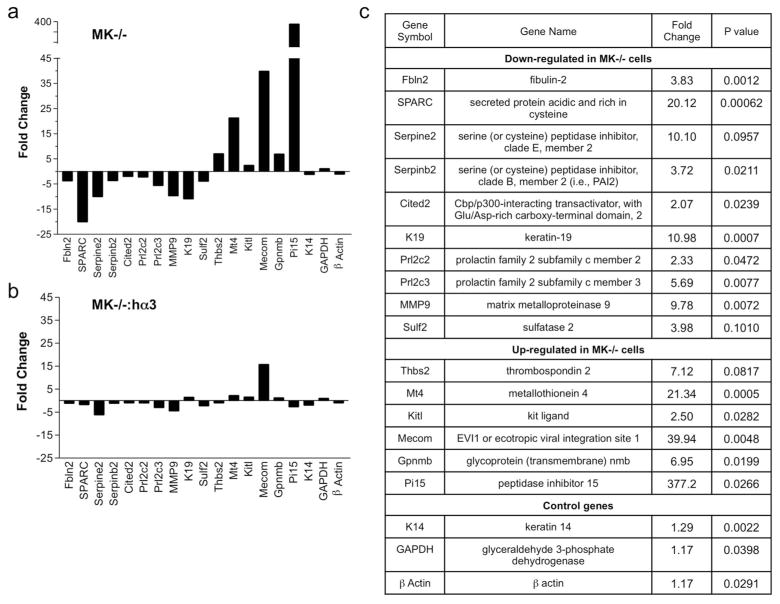
Figure 1.
qPCR validation of α3β1-dependent genes in immortalized MK cells. A subset of α3β1-regulated genes identified by microarray analysis (Fig. S1) was analyzed by qPCR. Analysis was focused on a selection of genes confirmed as α3β1-dependent through restoration of original expression levels in MK−/− cells following stable expression of human α3. (a, b) Graphs depict gene expression changes as fold decrease (negative value) or increase (positive value) in (a) MK−/− cells or (b) MK−/−:hα3 cells, each relative to MK+/+ cells. (c) Summary of changes in genes that are down-regulated or up-regulated in MK−/− cells compared to MK+/+ cells. Data are mean of three experiments; P values calculated based on Student’s t-test of replicate 2^(−Delta Ct) values for each gene in control group and treatment groups.

