Figure 3.
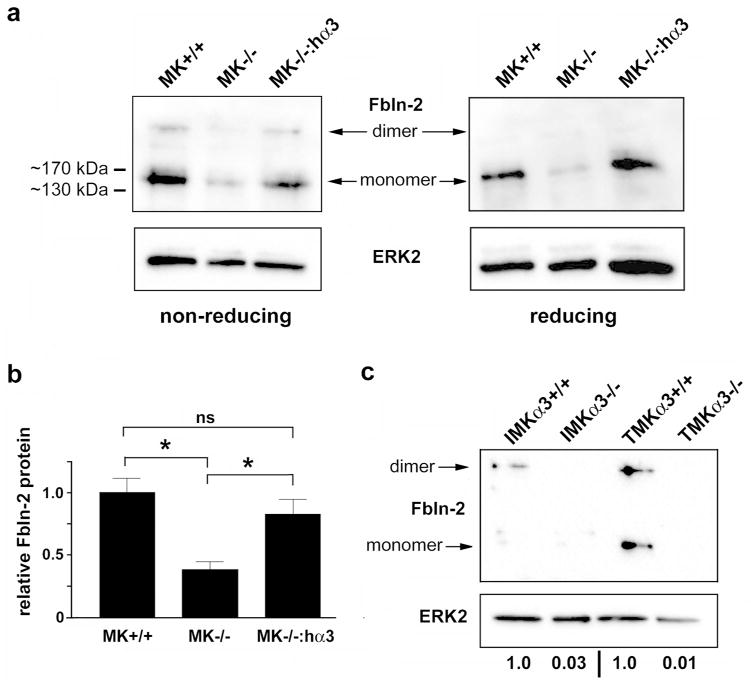
Absence of α3β1 is associated with reduced fibulin-2 protein. (a) Total lysates from LTAg-immortalized MK+/+ cells, MK−/− cells, or MK−/−:hα3 cells were resolved on non-reducing or reducing gels and immunoblotted with anti-fibulin-2 (Fbln-2, top), or anti-ERK2 (bottom) as loading control. Arrows indicate positions of disulfide-linked homodimeric and monomeric fibulin-2. Molecular weight markers shown at left. (b) Graph shows quantification in MK cells of total fibulin-2 (dimeric plus monomeric), normalized to ERK-2. Data are mean ± s.e.m.; n=4; one-way ANOVA, *P<0.05; Tukey’s multiple comparison; ns, not significant. (c) Cell lysates (non-reduced) from p53-null immortalized MK cells (IMKα3+/+ or IMKα3−/−) or RasV12-transformed cells (TMKα3+/+ or TMKα3−/−) were immunoblotted as above; representative of three experiments. Relative signal intensity for total fibulin-2, normalized to ERK-2, is listed below lanes.

