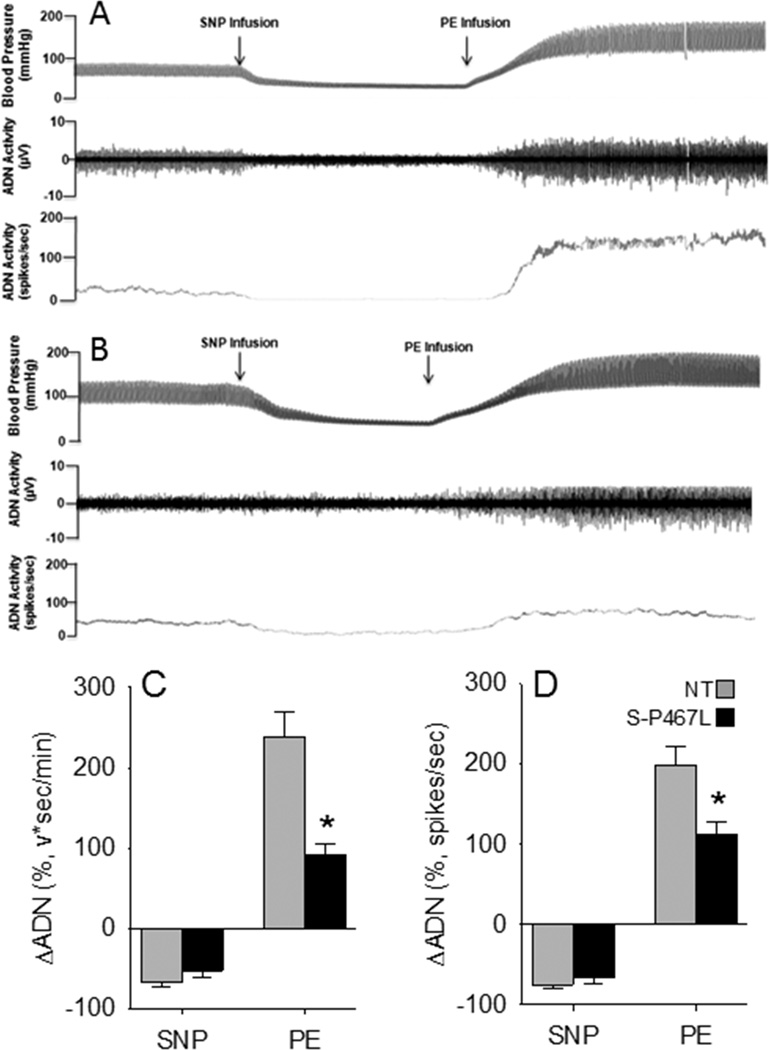
Figure 4. Relationship Between Arterial Pressure, HR and Aortic Depressor Nerve Activity.
Representative tracings of blood pressure and ADN activity in anesthetized NT (A) and S-P467L (B) mice. The change in ADN activity (C–D) is shown in response to changes in arterial pressure induced by infusion of sodium nitroprusside (SNP) followed by phenylephrine (PE). S-P467L (black) and non-transgenic (gray) mice. NT (N=10); S-P467L (N=8); *, P<0.05 vs NT.

