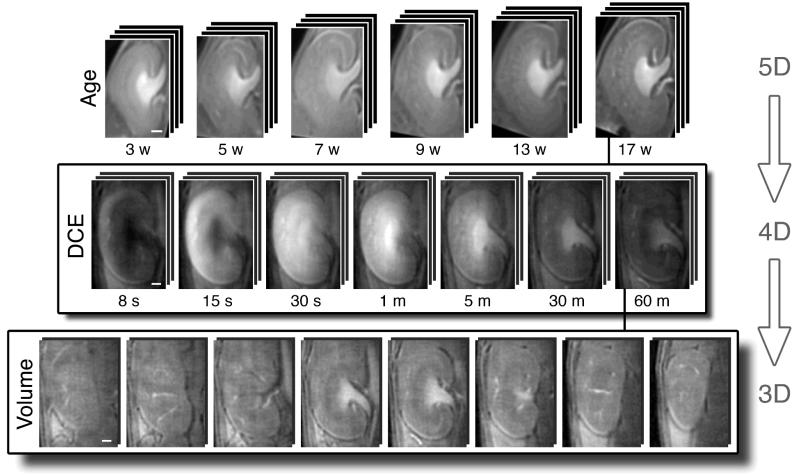
Figure 2.
Overview of the data. First row: Animals (n=5) were imaged over 17 weeks of development (at 3, 5, 7, 9, 13, and 17 weeks). Second row: Representative time points from the DCE dataset (390 time points) at one age. Third row: Representative slices from the DCE dataset at one time point. Scale bars = 1 mm. The mouse head is towards the top of the image.

