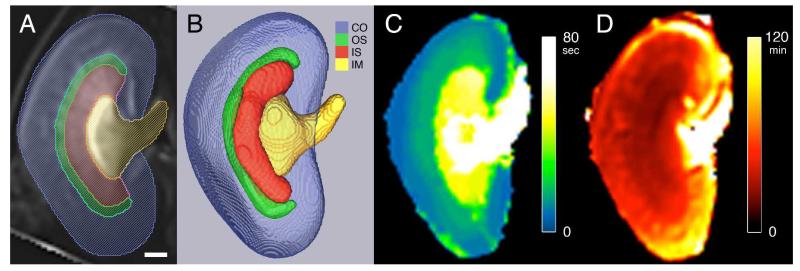
Figure 4.
Segmented renal structures and functional maps. Segmented regions overlaid on a tVIP MRI (A) and volume rendering of regions (B). Regions shown in A and B: cortex (CO, blue), outer stripe (OS, green), inner stripe (IS, red), and inner medulla (IM, yellow). C: Time-to-peak (TTP) map. D: Decay constant (DC) map. Scale bar = 1 mm.

