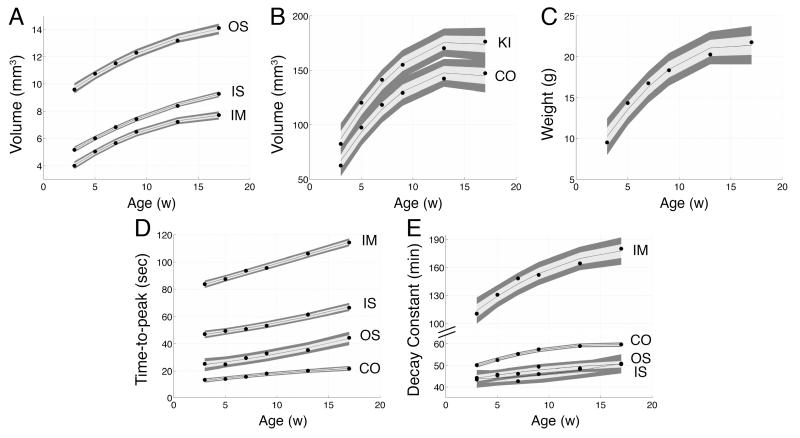
Figure 5.
Plots showing kidney development with age. Measured regions: kidney (KI), cortex (CO), outer stripe (OS), inner stripe (IS), and inner medulla (IM). A-B: Region volumes. C: Animal body weight. D: Time-to-peak values. E: Decay constants. measurements (region volume and body weight) are fitted with a 2nd-order polynomial function (black line in A-C). Functional measurements (TTP and DC) are fitted to a linear function (black line in D-E). The gray band shows the 95% confidence interval.

