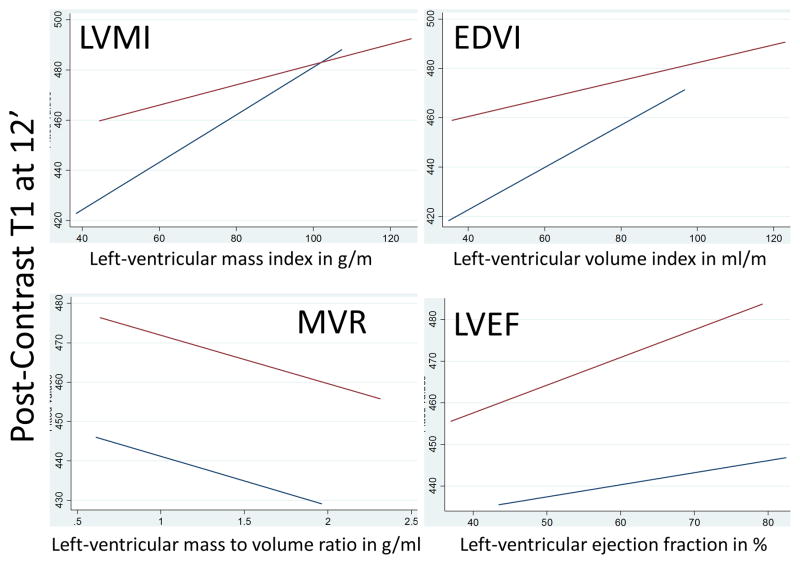
Figure 1.
Plots showing adjusted linear regression fits for men (red line) and women (blue line) with LV structure and function parameters at year-10 on the x-axis and post-contrast T1 times in ms at 12 minutes at year-10 on the y-axis. Linear regression fits obtained after adjustment for traditional cardiovascular risk factors.

