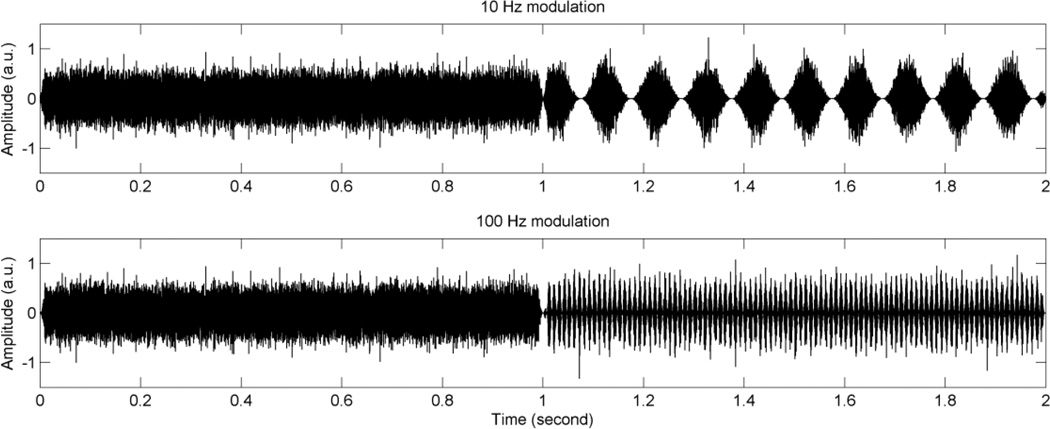
Figure 2.
Waveforms for the temporal modulation detection test. In this example, modulated signals are presented in the second interval (between 1 and 2 seconds). Unmodulated wideband noise is presented in the first interval (between 0 and 1 second). The upper panel shows an example of 10 Hz modulation frequency, and the lower panel shows an example of 100 Hz modulation frequency. Modulation depth of 100% is used for this illustration.

