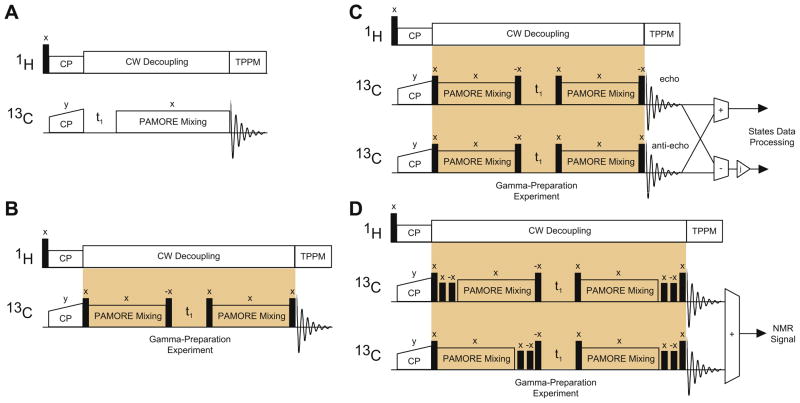
Fig. 2.
Panel A in the figure shows the basic 13C–13C correlation experiment using the PAMORE pulse element as the building block. The build up of the cross-peaks is used to generate a build up curve for the PAMORE recoupling. In (5), this corresponds to . Panel B shows the pulse sequence for the gamma-preparation experiment. The x phase on the PAMORE recoupling block indicates the initial phase at the start of PAMORE recoupling. Panel C shows the initial processing of the two Gamma-Prep experiments before processing by States to achieve sensitivity enhancement. Multiplication by j, shown in triangle in Fig. C, generates cosine and sine modulated signals for states processing, see Eqs. (31) and (32). Panel D shows combining two Gamma-Prep experiments with suitably placed half rotor period delays to isolate the Gamma-Prep signals and suppress other peaks in the 2D spectra. All hard pulses are pulses.

