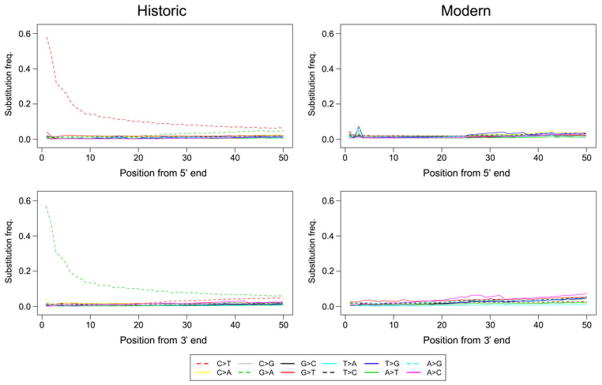
Fig. 2. Patterns of mismatches in historic and modern Tamias alpinus sequences.

The frequencies of the 12 types of mismatches (y axis) are plotted as a function of distance from the 5′ and 3′-ends of the sequence reads (x axis). The first 50bp of the sequence reads are shown. The frequency of each particular mismatch type is calculated as the proportion of a particular alternative (non-reference) base type at a given site along the read, and is coded in different colors and line patterns explained at the bottom of the plots: “X > Y” indicates a change from reference base type X to alternative base type Y.
