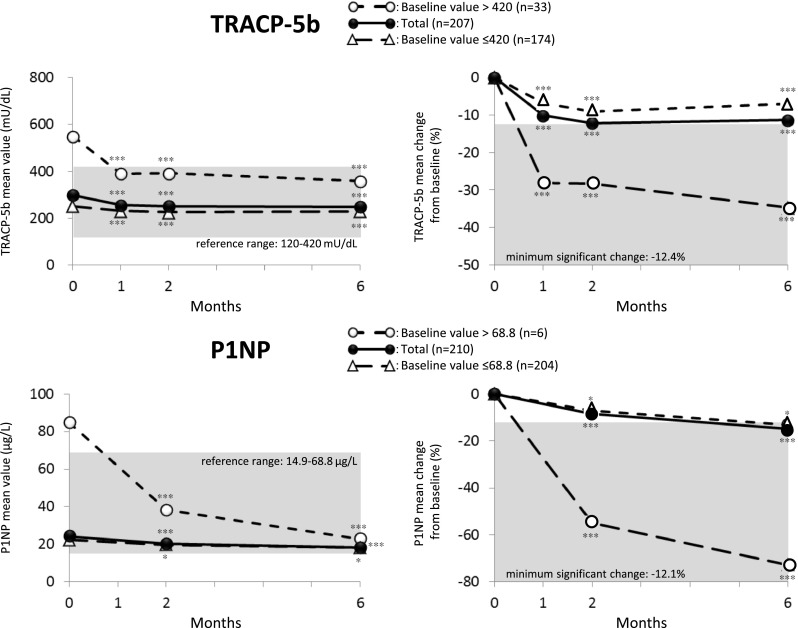
Fig. 3.

Time course of change in TRACP-5b (upper) and P1NP (bottom) after switchover to MIN 50 mg. Data were evaluated in patients who completed the 6-month measurements. ***p < 0.001; *p < 0.05, significantly different from baseline as analyzed by Wilcoxon signed-rank test
