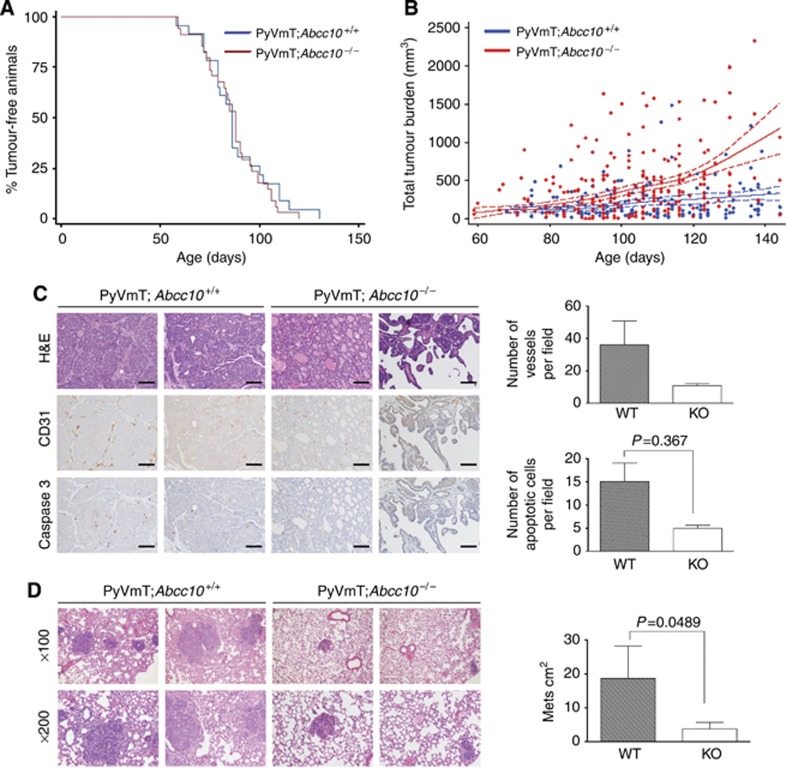
Figure 2.
Tumour development in MMTV-PyVmT mice with Abcc10−/− and Abcc10+/+ genotypes. (A) Kaplan–Meier curve analysis did not indicate significant differences in timing of tumor incidence in MMTV-PyVmT; Abcc10−/− (red line; n=26) vs MMTV-PyVmT; Abcc10+/+ (blue line; n=21) mice. (B) Comparison of growth rates of MMTV-PyVmT; Abcc10−/− mammary tumours and MMTV-PyVmT; Abcc10+/+ tumours. (C) H&E, CD31, and Caspase 3-stained sections of tumours isolated from MMTV-PyVmT;Abcc10+/+ and MMTV-PyVmT; Abcc10−/− mice (n=5 per genotype). Scale bar, 100 μm. (D) H&E-stained lung sections isolated from MMTV-PyVmT; Abcc10+/+ and MMTV-PyVmT; Abcc10−/− mice. Error bars denote mean±s.e.m. Statistical significance was determined by two-sided Student's t-test.

