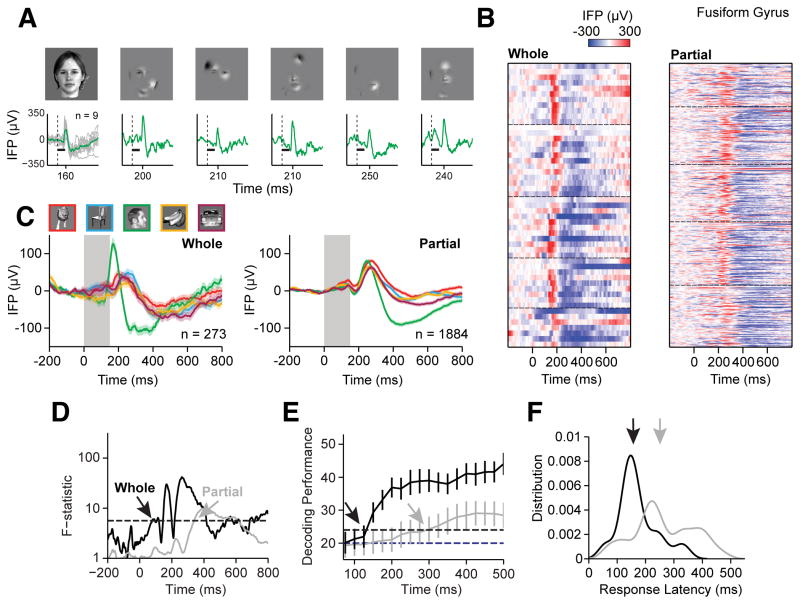
Figure 2. Example physiological responses from Main experiment.
Example responses from an electrode in the left Fusiform Gyrus.
(A) Intracranial field potential (IFP) responses to an individual exemplar object. For the Whole condition, the average response (green) and single trial traces (gray) are shown. For the Partial condition, example single trial responses (green, n=1) to different partial images of the same exemplar (top row) are shown. The response peak time is marked on the x-axis. The dashed line indicates the stimulus onset time and the black bar indicates stimulus presentation duration (150 ms).
(B) Raster of the neural responses for Whole (left, 52 trials) and Partial (right, 395 trials) objects for the category that elicited the strongest responses (human faces). Rows represent individual trials. Dashed lines separate responses to the 5 face exemplars. The color indicates the IFP at each time point (bin size = 2 ms, see scale on top).
(C) Average IFP response to Whole (left) and Partial (right) objects belonging to five different categories (animals, chairs, human faces, fruits, and vehicles, see color map on top). Shaded areas around each line indicate s.e.m. The gray rectangle denotes the image presentation time (150 ms). The total number of trials is indicated on the bottom right of each subplot.
(D) Selectivity was measured by computing the F-statistic at each time point for Whole (black) and Partial (gray) objects. Arrows indicate the first time point when the F-statistic was greater than the statistical threshold (black dashed line) for 25 consecutive milliseconds.
(E) Decoding performance (mean±SD) using a linear multi-class discriminant algorithm in classifying trials into one of five categories. Arrows indicate the first time when decoding performance reached the threshold for statistical significance (black dashed line). Chance is 20% (blue dashed line).
(F) Distribution of the visual response latency across trials for Whole (black) and Partial (gray) objects, based on when the IFP in individual trials was significantly above baseline activity. The distribution is based on kernel density estimate (bin size = 6 ms). The arrows denote the distribution averages.

