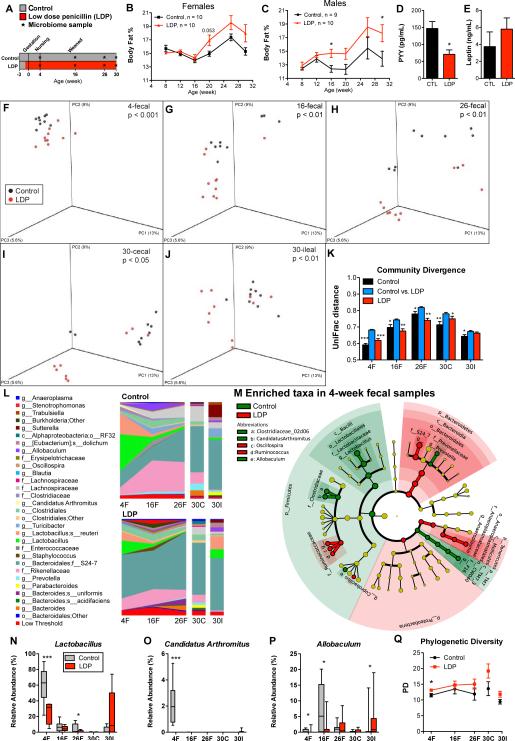
Figure 2. Dynamics of microbiota and adiposity changes over 30 weeks of life.
(A) Study design: Female and male C57B/L6 mice received low dose penicillin (LDP, n = 10 males and females), or no antibiotics (control, n = 9 males and 10 females) for 30 weeks. (B-C) Body fat percent over time, determined by DEXA scanning, in female and male mice. Serum levels of (D) peptide YY (PYY) and (E) leptin at week 30 in male mice. * p < 0.05 significantly different by t-test for B-E, and Q. (F-Q) Fecal specimens obtained at weeks 4, 16, and 26, and the terminal (week 30) cecal and ileal specimens from male mice were examined by sequencing the V1-2 region of the bacterial 16S rRNA gene. (F-J) Principal coordinate analysis (PCoA) of unweighted UniFrac distances of the intestinal microbiota at each sample point; p-values listed for differential clustering assessed by ADONIS test. (K) Divergence within (control vs control, LDP vs LDP) and between communities (control vs LDP) measured by unweighted UniFrac distance. The UniFrac matrix was permutated 10,000 times; p-values represent fraction of times permuted differences were greater than real distances; * p < 0.05 , **p < 0.01, *** p < 0.001 significantly different from intragroup distance. (L) Mean relative abundance of predominant bacteria (>1% in any sample) in control and LDP mice. Taxa are reported at the lowest identifiable level, indicated by the letter preceding the underscore: o, order; f, family, g, genus; s, species. (M) Cladograms, generated from LEfSe analysis, represent taxa enriched in control (green) or LDP (red) 4-week fecal microbiota. The central point represents the root of the tree (Bacteria), and each ring represents the next lower taxonomic level (phylum through genus). The diameter of each circle represents the relative abundance of the taxon. When full identification was not possible, g_ or s_ alone was used for genus or species, respectively. (N-P) Relative abundance of Lactobacillus, Candidatus Arthromitus (SFB), and Allobaculum; asterisks indicate level of significance by Mann-Whitney U test, see also Figure S1 and Table S1. (Q) Phylogenetic diversity in control and LDP male mice (Mean ± SEM), calculated at a uniform depth of 4,000 sequences/sample.

