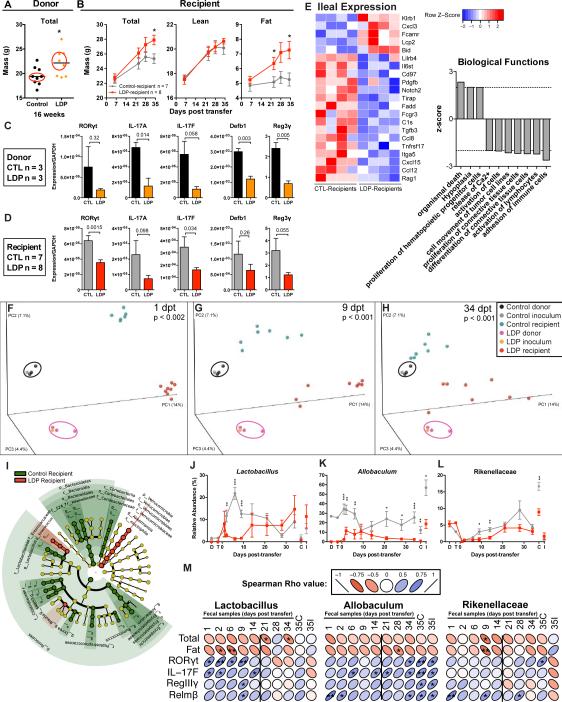
Figure 7. Metabolic, immunologic, and ecological consequences of transferring LDP-altered microbiota.
Cecal microbiota from 3 control and 3 LDP 18-week old female C57B/L6J mice were collected, pooled, and transferred to 3-week old germ-free female Swiss-Webster mice by oral gavage. (A) Microbiota donors were selected based on the median total mass determined by DEXA scanning at week 16. (B) Total, lean, and fat mass in the now-conventionalized germ-free control- and LDP-microbiota recipient mice (n = 7 and 8, respectively), measured by DEXA scanning over the 35-day experiment. (C-D) Ileal gene expression in microbiota donor (n = 3 CTL, LDP) (C) and recipient (n = 7 & 8, CTL, LDP, respectively) (D) mice measured by qPCR, p-values listed from t-tests. (E) Expression of ileal genes significantly different between control- and LDP recipients (n = 4 each), measured by the Nanostring Mouse Immunology Kit, (p < 0.05, t-test). Biological functions predicted to be significantly increased (p< 0.05, z > |2|) in LDP mice based on Ingenuity Pathway Analysis of Nanostring expression values. (F-H) Community structure assessed by PCoA of unweighted UniFrac distances of microbiota samples: donor cecum; the transferred inoculum; and the recipient mouse fecal samples at days 1, 9, and 34 post-transfer (dpt). Significant differences in clustering between control and LDP were calculated by ADONIS test. (I) LEfSe cladogram depicting taxa in fecal samples from 1-14 dpt that are significantly increased in control (green) or LDP (red) specimens. Relative abundance of (J) Lactobacillus, (K) Allobaculum, and (L) Rikenellaceae, significant differences assessed by Mann-Whitney U. Graphs are displayed as mean ± SEM. (M) Spearman correlations between host phenotypic measurements and candidate protective taxa found in multiple experiments. The vertical lines separate the early (pre-phenotype) time-points. * p < 0.05. See also Figure S6-7 and Table S6.

