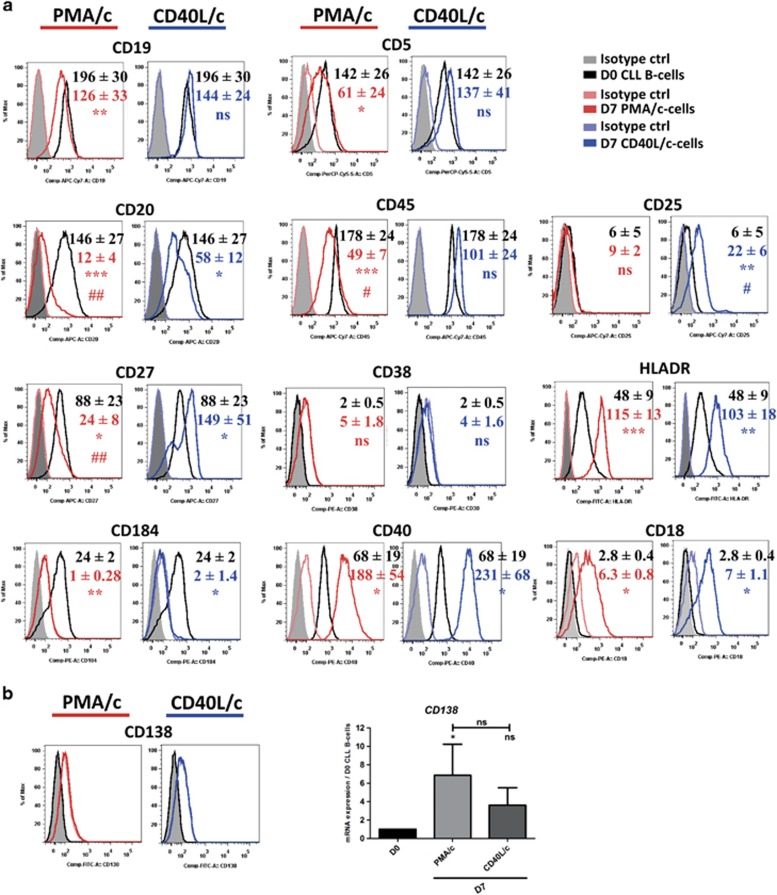
Figure 3.
The immunophenotype of D7 cells. (A) On D0 and D7, cell immunophenotype was studied by direct labeling of CD19, CD20, CD27, CD184, CD5, CD45, CD38, CD40, CD25, HLA-DR, CD18 and CD138. (a) RFIs were calculated as the ratio of the MFI of cells labeled with a specific Ab to that of cells labeled with a matched isotype control. Mean RFI values±s.e.m. from eight independent experiments are represented with a color code: Black: D0, red: D7 PMA/c-stimulated cells, blue: D7 CD40L/-stimulated cells. Cytometry data are presented as plots for a representative patient. (b) Cytometry plot of CD138 expression for a representative patient. The expression of the CD138 gene was evaluated by quantitative real-time RT-PCR in D0 CLL B cells and D7 stimulated cells. Results are expressed relative to gene expression in CLL B cells on D0, according to the 2−ΔΔCT method. Bars represent mean values±s.e.m. from five independent experiments. Statistical significance was calculated using a the Wilcoxon test. *The D7 value is different from that in D0 CLL B cells. #The D7 value is different between PMA/c- and CD40L/-stimulated cells. *, #P<0.05, **, ##P<0.01, ***P<0.001. ns, not significant. D, day.

