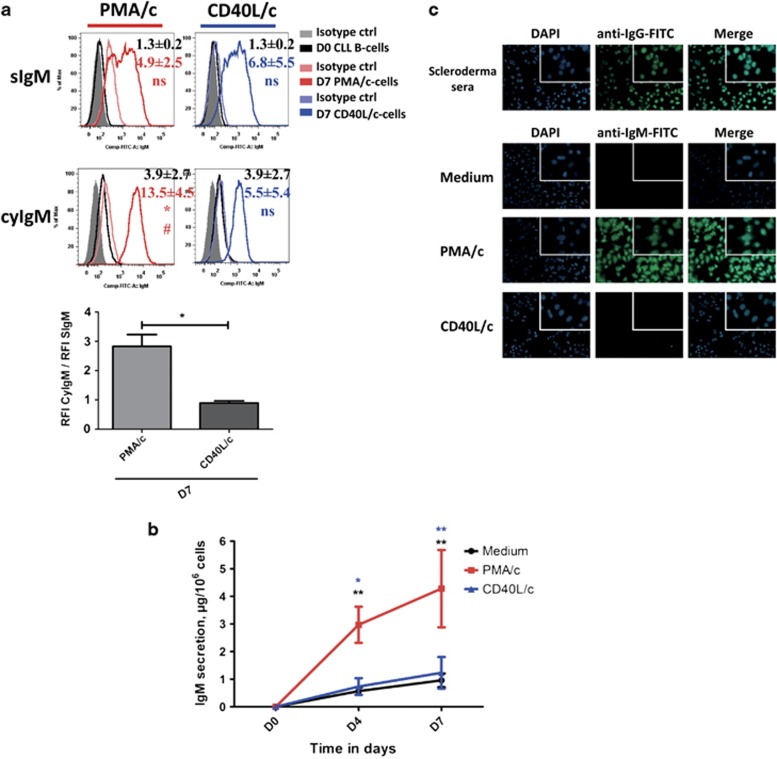
Figure 4.
IgM expression and secretion by PMA/c- and CD40L/c-stimulated cells. (a) D0 CLL B cells and D7 PMA/c- and CD40L/c-stimulated cells were labeled before and after permeabilization with fluorescein isothiocyanate-conjugated anti–human IgM mAbs or isotype control mAbs. The cytometry plots are representative of three independent experiments. The bar histogram shows the ratio of RFI for cytoplasmic IgM to that for surface IgM. RFI was calculated as the ratio of the MFI of cells labeled with a specific Ab to that of cells labeled with a matched isotype control. Data are representative of three independent experiments. Significance was calculated using the paired Student's t-test. (b) Culture supernatants were harvested on D4 and D7. IgM secretion was assessed with an enzyme-linked immunosorbent assay. The results are expressed as the mean±s.e.m. (in μg per 106 cells) for five independent experiments. Significance was calculated using the Wilcoxon test: *P<0.05, **P<0.01. S, surface, Cy, cytoplasmic, D, day. (c) Indirect immunofluorescence analysis showed that the IgM secreted into the culture supernatant of PMA/c-stimulated cells recognized autoantigens in HEp-2 cells. Magnification: × 200. Magnification for insets: × 630.

