Fig. 1.
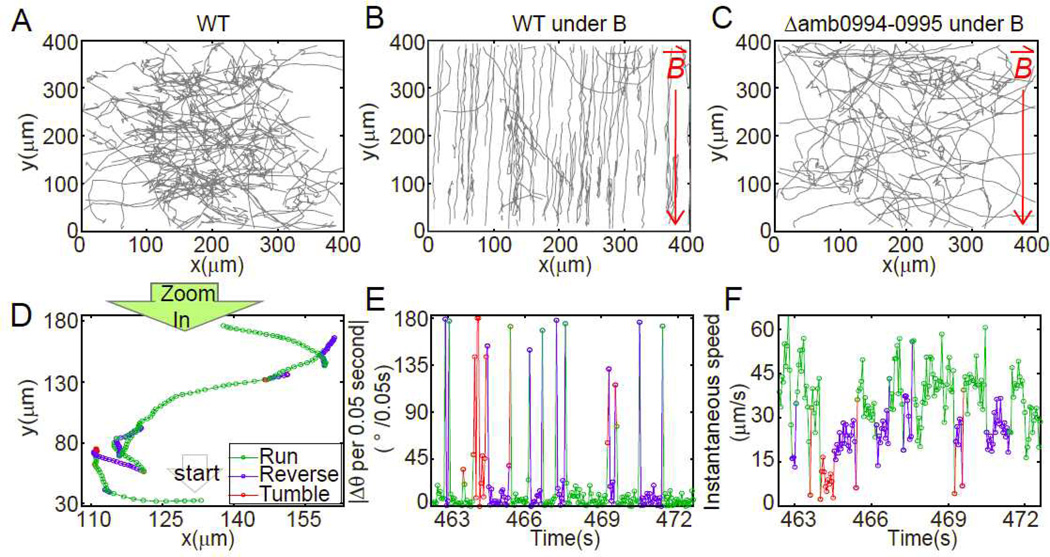
The tracks of AMB-1 show the magnetotactic behavior (A–C) and the three-state swimming pattern (D–F). 80 trajectories in 10 minutes were displayed for (A) WT cells at control condition; (B) WT cells under 1.0mT applied magnetic field; (C) Δamb0994-0995 deletion cell under 1.0mT applied magnetic field. Red arrows pointed to the direction of applied magnetic field. (D) Single trajectory can be resolved into three states. Small circles represent the position at an equal time interval of 0.05s. The corresponding sequential angular change per observation time (0.05s) and instantaneous speed are shown in (E) and (F) respectively. Green, blue and red mark the run, reverse and tumble states respectively.

