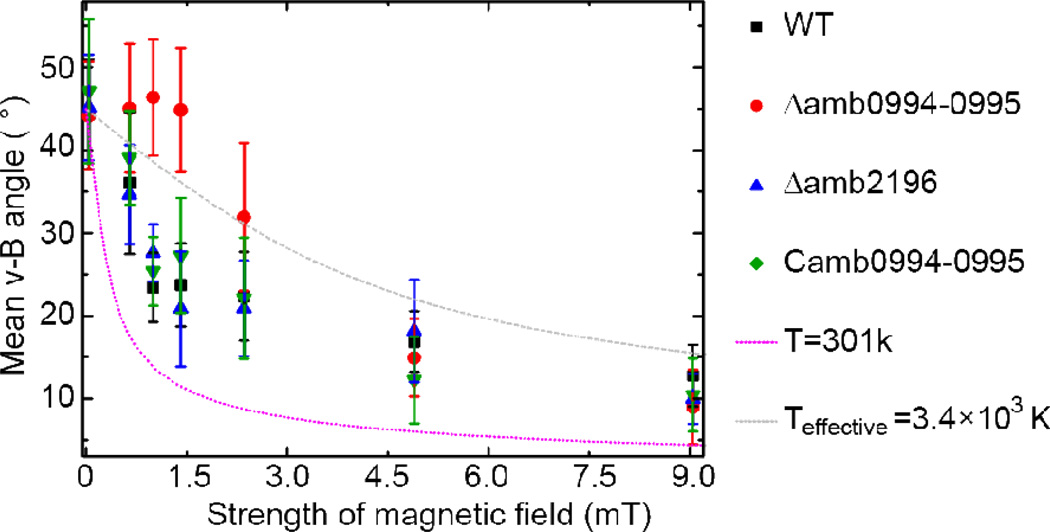
Fig. 6.
The mean of v-B angle as a function of magnetic intensity. About 12 bacteria were traced for 12s for each condition. The pink line is the result of the passive alignment model with the room temperature. The gray line is obtained by fitting the passive alignment model with the experimental data, which results to an effective temperature Teffective=3,400K (see text for details). The bar indicates the stand error () of the population, where n is the number of bacteria.

