
Fig 7. Differential scanning calorimetry (DSC) of WT and E-to-Q BsSecA and EcSecA.
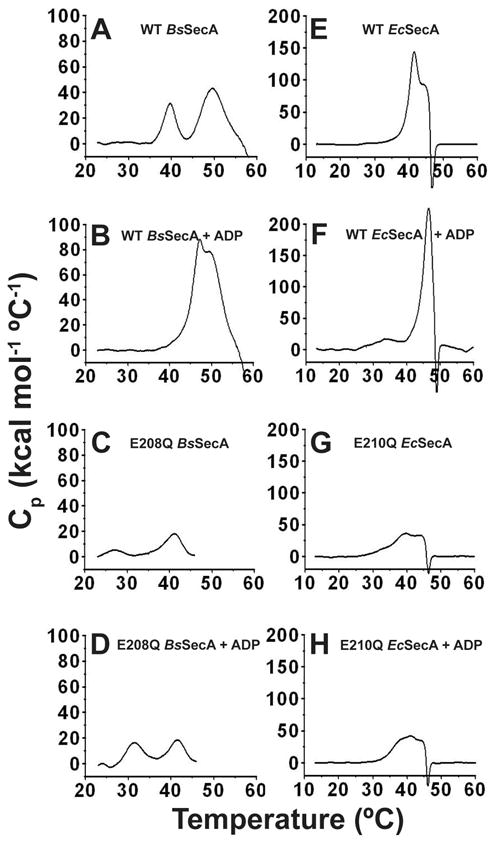
All DSC scans were conducted on the same instrument at 1 °C per minute in TKM buffer (pH 8.0). The same vertical scale is used here for all experiments conducted on enzymes from the same organism, while Fig. S6 shows the same data replotted with the vertical scale adjusted to enable clear visualization of the details of the transitions in each experiment. (A,B) 10 μM WT-BsSecA without (panel A) or with (panel B) 1 mM Mg-ADP. (C,D) 20 μM E208Q-BsSecA without (panel C) or with (panel D) 1 mM Mg-ADP. (E,F) 10 μM WT-EcSecA without (panel E) or with (panel F) 1 mM Mg-ADP. (G,H) 20 μM E210Q-EcSecA without (panel G) or with (panel H) 1 mM Mg-ADP. Protein aggregation following the second conformational transition, which is probably unfolding of NBF-I, likely contributes to the very large magnitude of Cp in some experiments. This phenomenon prevents reliable integration of enthalpy. However, it does not interfere with observation of the temperature and approximate magnitude of the initial transition corresponding to the ECT. The data shown here for WT BsSecA accurately recapitulates previously published results 23,24.