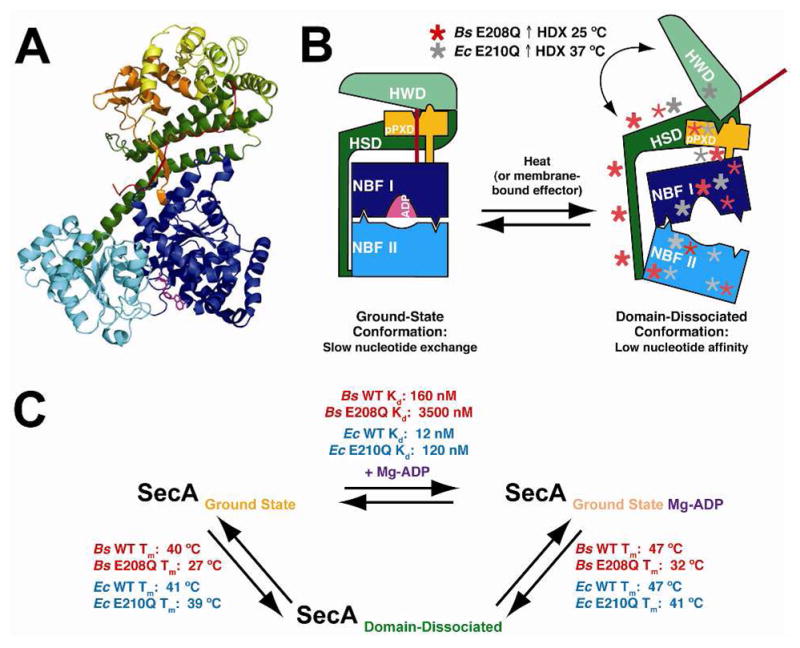
Figure 9. Schematic diagram summarizing conformational changes during the ECT and related features of the HDX data.

(A) A ribbon diagram of the BsSecA crystal structure (1M6N) bound to Mg-ADP (magenta) shows each domain colored separately to correspond to the labeled domains in panel B. (B) Schematic diagram showing key features of the endothermic conformational transition (ECT) between the ground state and the domain-dissociated state of SecA. The domain-dissociated state is marked with asterisks representing regions of increased mobility as measured by HDX in SecA mutants compared to the corresponding WT enzymes. Increases in BsSecA E208Q HDX are depicted in red, and increases in EcSecA E210Q HDX are shown in grey. Bold asterisks represent regions with large changes in HDX rates. (C) Schematic diagram showing equilibria between the major conformational states of SecA along with associated thermodynamic parameters.
