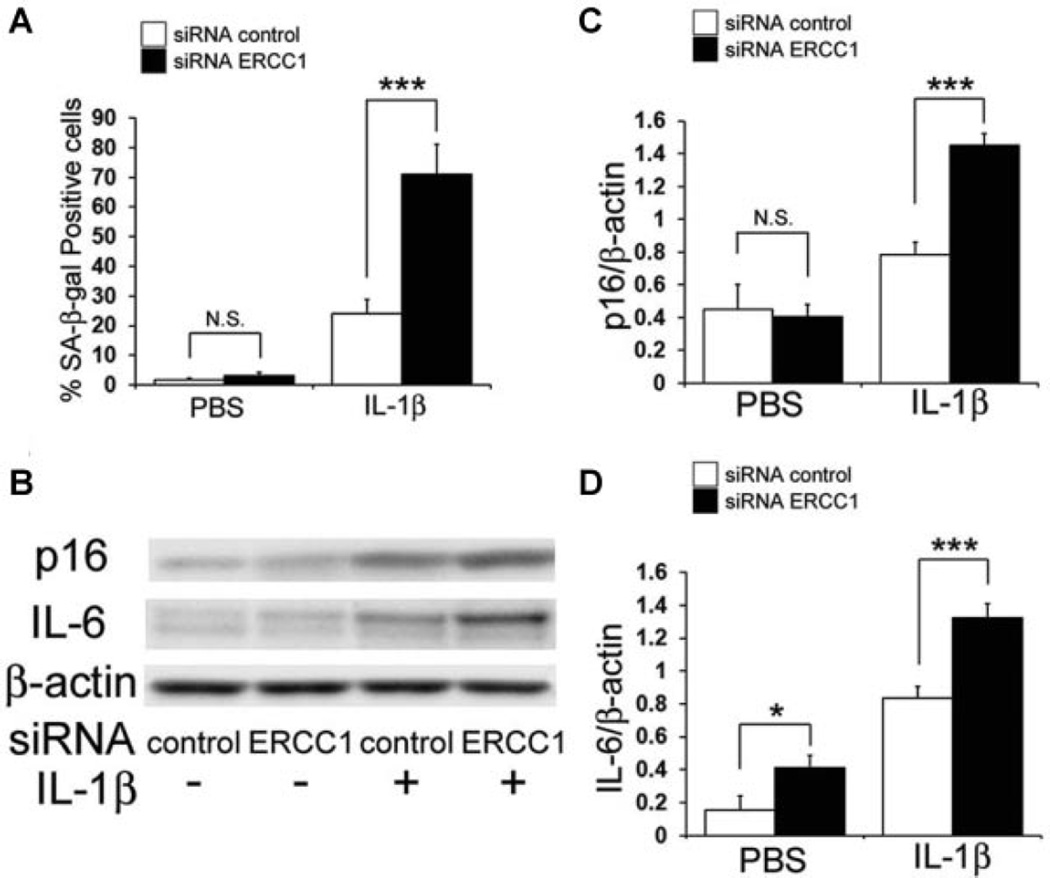
Figure 4.
Effect of ERCC1 inhibition on cellular senescence in HC under IL-1β stimulation. (A) Plotted is the average of SA-β-gal-positive cells. Error bars indicate the SD (***p < 0.001). (B) Shown is a representative image of an immunoblot measuring the expression levels of p16 and IL-6 in HC. Quantification of the expression ratios of p16(C) and IL-6 (D) to β-actin were calculated. Error bars indicate the SD. *p < 0.05, ***p < 0.001, not significant (NS).

