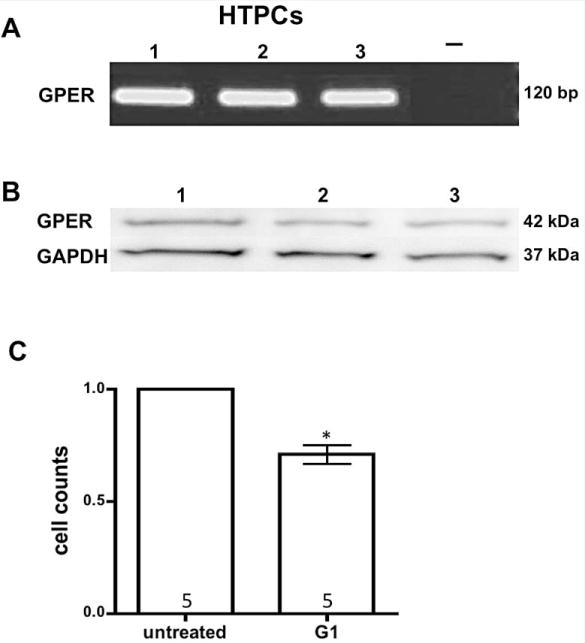
Figure 2. GPER-expression in isolated human testicular peritubular cells.

Result of a representative RT-PCR experiment (A) using HTPCs of three different donors (1–3). A single band at the expected size of 120 bp is depicted, which upon sequencing was found to correspond to human GPER. Negative control (−) including RNA instead of cDNA showed no band.
Western blot (B) of GPER was performed with 10 μg of total proteins extracted from 3 different HTPCs (1–3) showing a band of 42 kDa. The membrane was stripped and reprobed for GAPDH (37 kDA) as a loading control.
Analysis of cell number and their viability using CASY (C) revealed a significant lower cell count in G1 stimulated HTPCs after 24 h compared to vehicle treated cells. n = 5; Student’s t-test, p < 0.05.
