Figure 1.
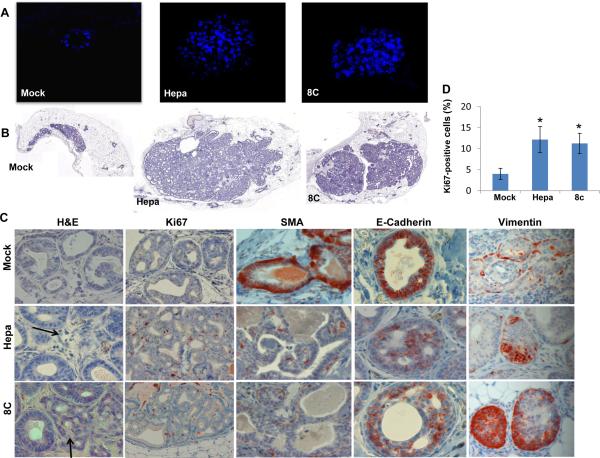
Heparanase promotes the formation of disorganized acinar structures by MCF10A cells and tumoriginicity of MCF10AT1 cells. A. Acinar structures formation. Control (Mock), heparanase (Hepa), and 8C-infected MCF10A cells were plated on, and overlaid with Matrigel for 10 days. Formation of three-dimensional acini-like structures was evaluated by fluorescent confocal imaging applying DAPI nuclei counterstaining. B. Tumorigenicity of MCF10AT1 cells. MCF10AT1 cells were infected with control (Mock), heparanase, or 8C gene constructs and inoculated into SCID/beige mouse mammary fat pad (n=6). Xenografts were harvested 12 weeks after cell transplantation and formalin-fixed, paraffin-embedded 5 micron sections were subjected to histological analyses. Shown are representative images of whole sections scanned by 3DHISTECH Pannoramic MIDI System attached to HITACHI HV-F22 color camera (3dhistech kft, Budapest, Hungary). C. Immunostaining. Xenografts produced by MCF10AT1 infected cells were stained with hematoxilin and eosin (left panels), anti- Ki67 (second left panels), anti-smooth muscle of actin (SMA, middle panels), anti-E-cadherin (second right panels), and anti-vimentin (right panels) antibodies. Original magnifications: left and right panels: ×40; middle panels ×10. Quantification of Ki67-positive cells is shown graphically in D. *p=0.01 for Mock vs. heparanase and Mock vs. 8C.

