Figure 1.
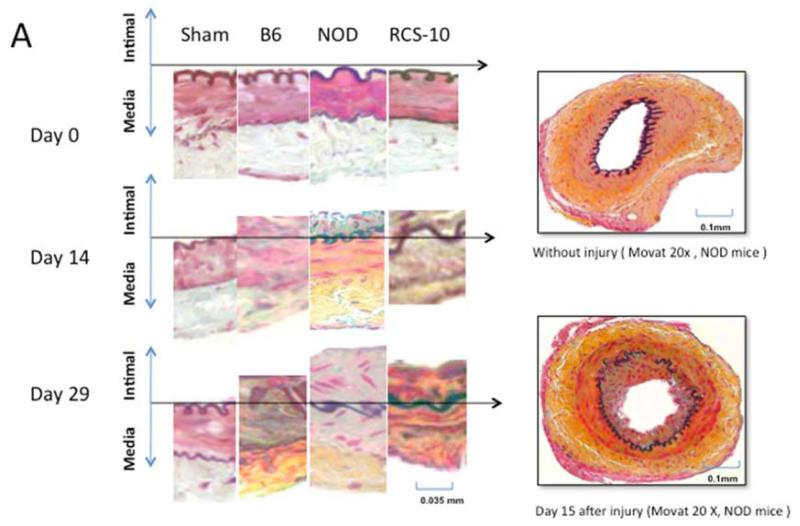
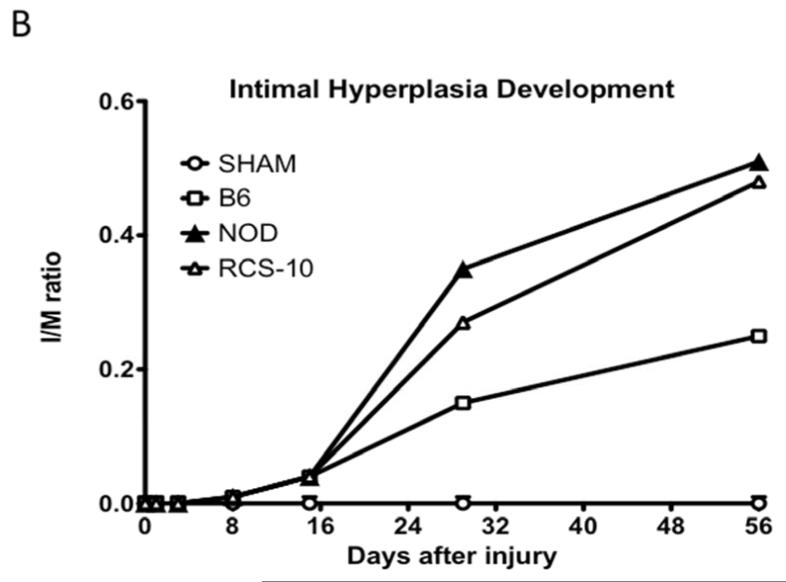
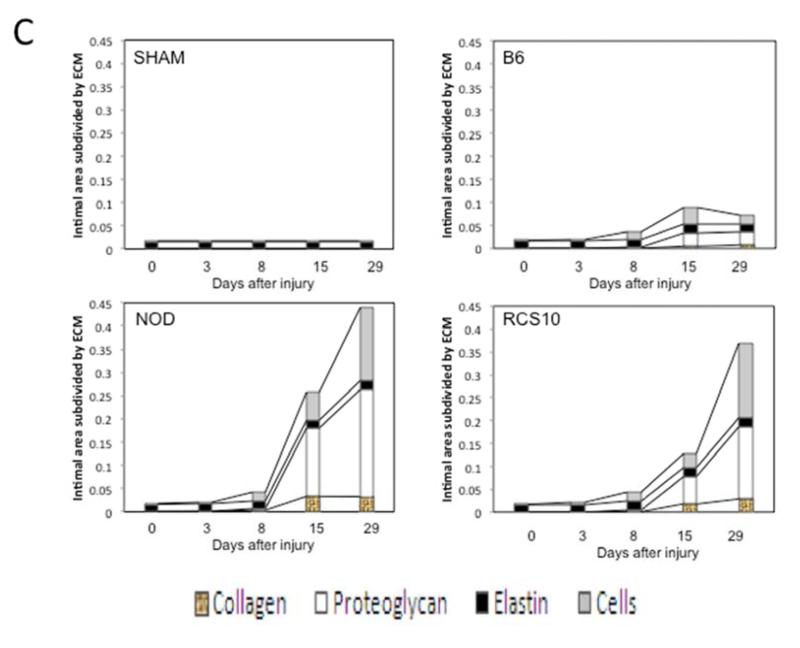
Changes in the intimal hyperplasia response in wire-injured femoral vessels in sham operated (sham), control B6, diabetic (NOD) and metabolic syndrome (RCS-10) groups. (A) shows histological cross sections of the vessel wall stained with Movat’s stain in the left panel and representative full cross-sections of the vessel in the right panel. The stain shows proteoglycans as blue, collagens as yellow, nuclei as black, muscle as red, fibrin as bright red and elastic fibers as dark purple. (B) shows the changes in Intima / Media ratio over the time course of the experiment. Values are the mean± s.e.m. (n=6 per group). (C) shows the comparison of the area of cells, collagen, proteoglycan and elastin in wire-injured femoral vessels in sham, B6, diabetic (NOD) and metabolic syndrome (RCS-10) groups. Values are the mean± s.e.m. (n=6 per group). Statistical differences between groups were tested with a Kruskal-Wallis non-parametric test with post hoc Dunn’s multiple comparison correction, where appropriate.


