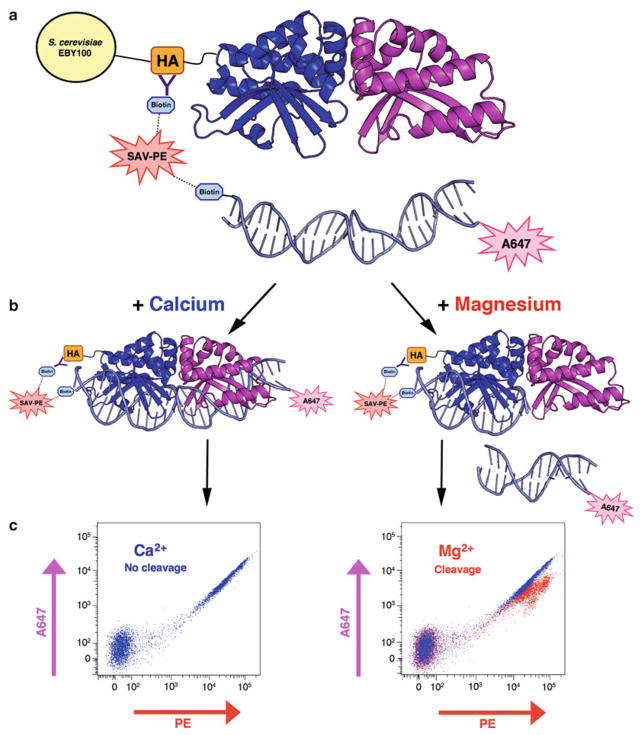
Fig. 3.
Schematic representation of the flow-cytometric DNA cleavage assay. (a ) An N-terminal hemagglutinin (HA) tag enables biotin–streptavidin tethering of a fluorescently labeled, double-stranded DNA substrate to the enzyme. (b ) In the presence of calcium, the enzyme can bind the DNA substrate but not cleave it; with the addition of magnesium, the enzyme is able to bind and cleave the target substrate. When cleavage occurs, the N-terminal tethered PE fluorescence will be maintained while the A647 signal on the opposite end of the DNA target is lost. (c) The tethered, intact target substrate produces a characteristic co-linear PE versus A647 fluo-rescence profile on the flow cytometer (left). Cleavage of the tethered substrate leads to a loss of fluorescence in the A647 channel. Superposition of PE versus A647 plots from the Ca2+ and Mg2+ samples can be used to roughly quantify cleavage activity (right)

