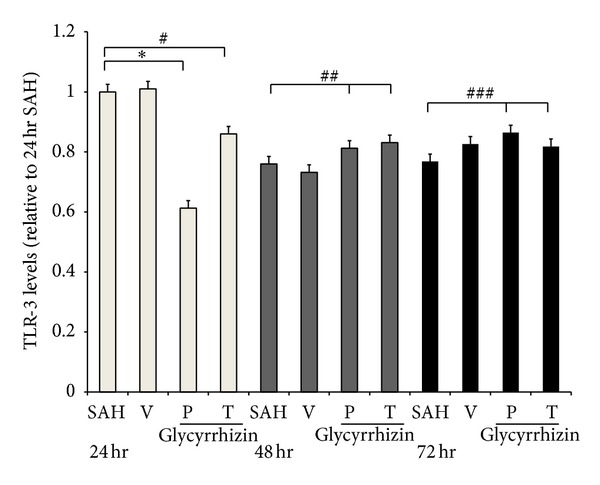
Figure 4.

Toll-like receptor 3 (TLR-3) expression on 24, 48, and 72 hr, respectively (Western blot). All groups are identical to those shown in the legend of Figure 3. *: P < 0.01; #, ##, ###: P > 0.05 represent glycyrrhizin treatment (24 hr), precondition and treatment with glycyrrhizin (48 and 72 hr, resp.), compared with the SAH groups.
