Figure 7.

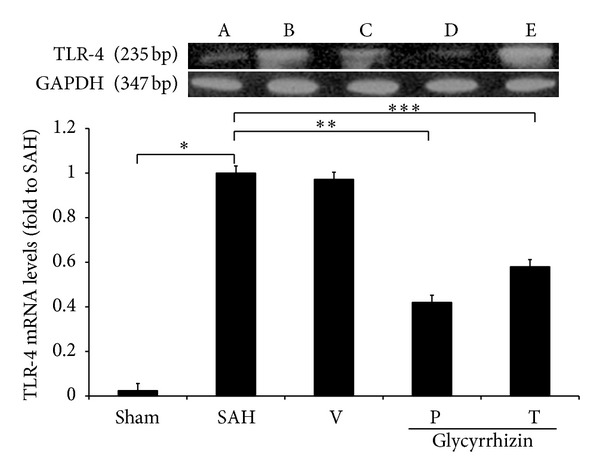
The alteration of TLR-4 mRNA in animals following SAH. All values are mean ± SD (n = 9). *, **, ***: P < 0.01, when compared with the SAH group. All groups are equal to those publicized in Figure 1.

The alteration of TLR-4 mRNA in animals following SAH. All values are mean ± SD (n = 9). *, **, ***: P < 0.01, when compared with the SAH group. All groups are equal to those publicized in Figure 1.