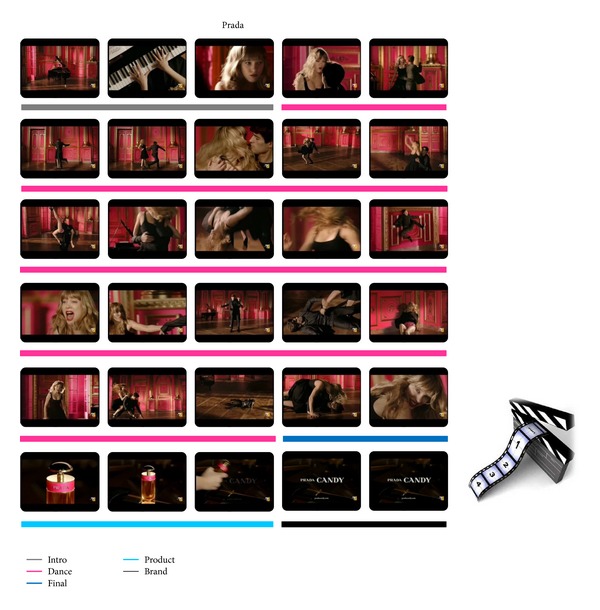
Figure 2.

Frame sequence of the Prada commercial for each second of the video clip. The underlying colors highlight the different scenes in which it is possible to divide the advertisement, as the legend shows. In such segments the average Z-scores values for the estimated indices were computed.
