
Figure 2.
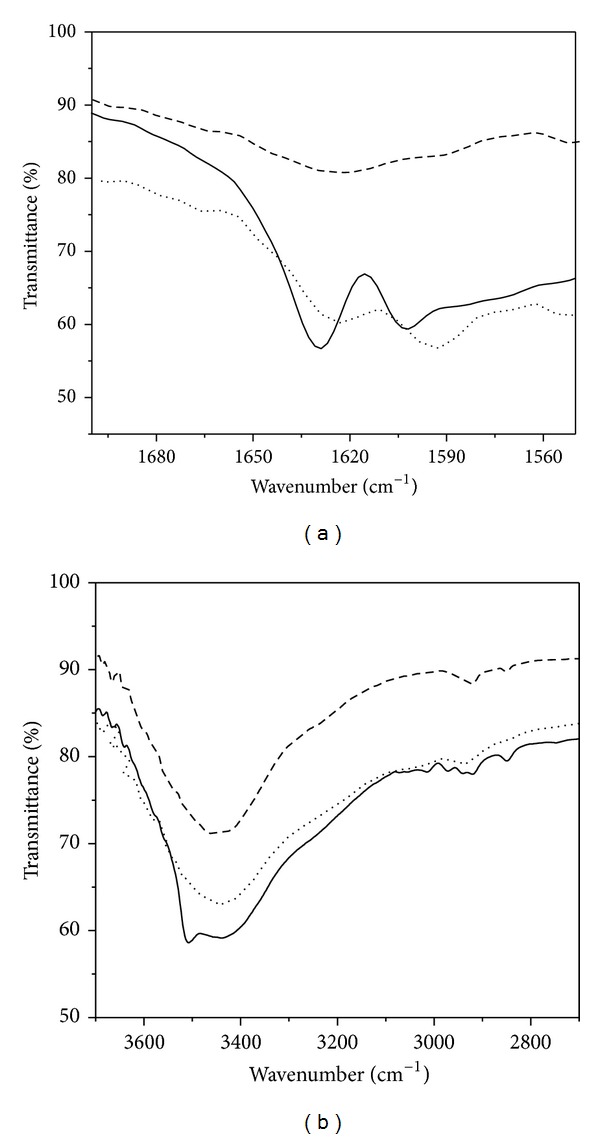
FTIR spectra of (a) 1500–1700 cm−1 region and (b) 2800–3800 cm−1 region of Curcumin (—), Curcumin-Cu(II) complex (- - -), and Curcumin-Zn(II) complex (····).
Official websites use .gov
A
.gov website belongs to an official
government organization in the United States.
Secure .gov websites use HTTPS
A lock (
) or https:// means you've safely
connected to the .gov website. Share sensitive
information only on official, secure websites.
FTIR spectra of (a) 1500–1700 cm−1 region and (b) 2800–3800 cm−1 region of Curcumin (—), Curcumin-Cu(II) complex (- - -), and Curcumin-Zn(II) complex (····).