
Figure 1.
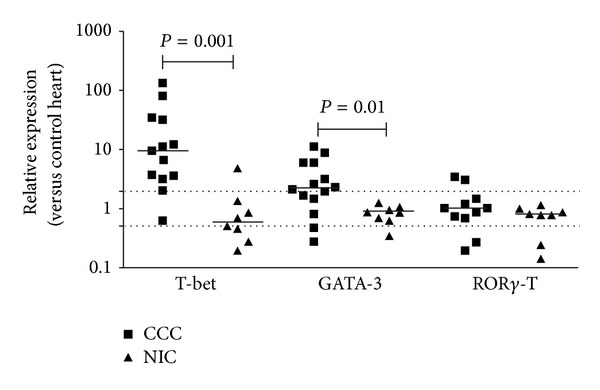
Expression of mRNA encoding transcription factors T-bet, Gata-3, and Rorγ-T in myocardium. Real-time qPCR analysis of mRNA expression in CCC and NIC myocardium. After normalization to GAPDH mRNA, relative increase was plotted in comparison to N group and data were calculated with the 2−ΔΔCt method, as described in Methods section. The horizontal bar stands for the median; dotted lines indicate twofold increase or decrease of expression as compared with the control group.