Figure 5.
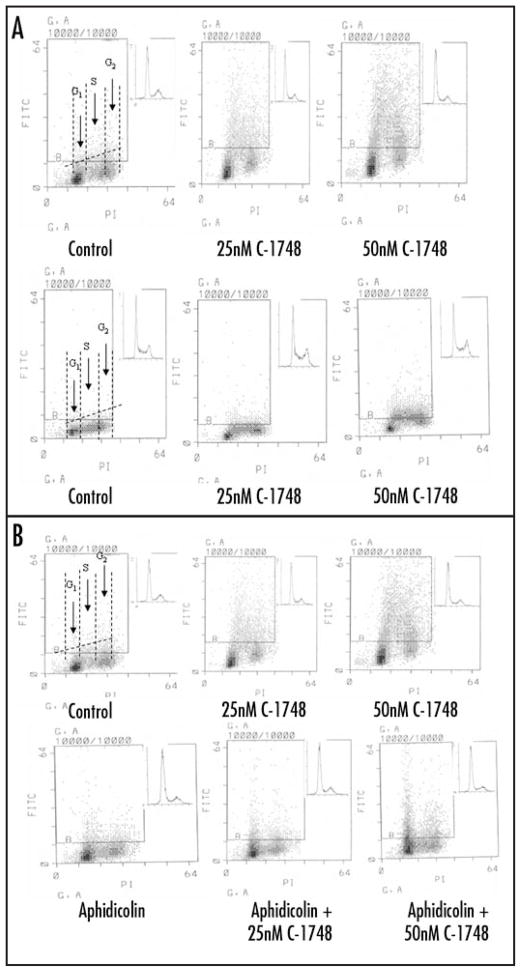
(A) C-1748 induces γH2AX in LnCaP and HL-60. Exponentially growing LnCaP (upper panel) and HL-60 (lower panel) cells, untreated (Control) or exposed to 25 and 50 nM C-1748 for 3 h and fixed with formaldehyde. Expression of γH2AX was measured concurrently with cellular DNA content by flow cytometry and data shown as bivariate γH2AX IF versus DNA content distributions. Over 93% cells (LnCaP) and 99% (HL-60) from the untreated (Control) culture had γH2AX IF below the threshold marked by the solid line. Inset in each panel shows cellular DNA content frequency histogram of untreated and treated cells. The dashed horizontal line indicates intrinsic H2A.X IF associated with each cell line. The dashed vertical lines in the left panel show boundaries separating cells in G1 vs S vs G2M phases of the cell cycle. (B) Aphidicolin inhibits induction of γH2AX in S phase LnCaP cells treated with C-1748. Exponentially growing LnCaP cells, untreated (control) or exposed to 2 μM aphidicolin for 20 min or 25 and 50 nM C-1748 in the presence of aphidicolin for 3 h. Expression of γH2AX IF was measured by FITC-tagged secondary antibody to γH2AX concurrently with cellular DNA content by flow cytometry and data shown as bivariate γH2AX IF versus DNA content distributions.

