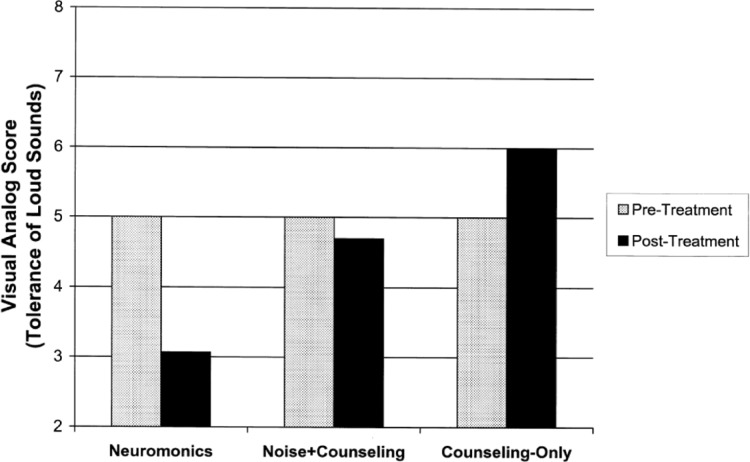
Figure 5.
Comparison of clinical outcomes achieved with Neuromonics Tinnitus Treatment versus control treatments (tolerance of loud sounds).
Note: Bars denote Visual Analog Scale scores rated on a scale from 0 to 10 prior to treatment (anchored at 5) and 12 months after commencement of treatment (improvements toward 0, deterioration toward 10). Changes were statistically significant for Neuromonics (p<0.001) but not for Noise+Counseling or Counseling-Only.

