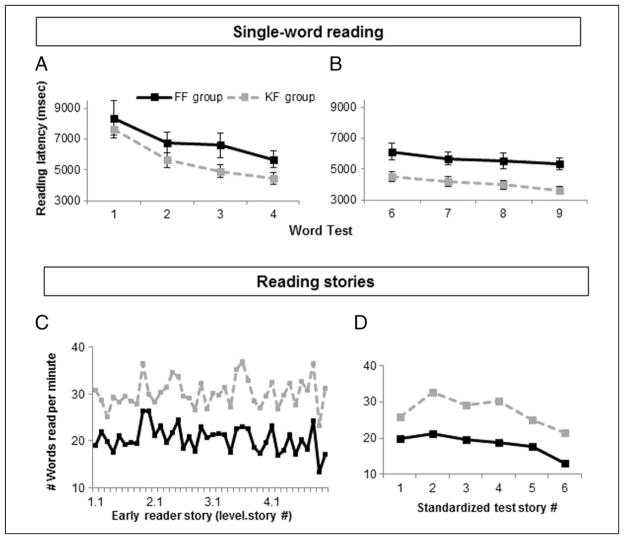
Figure 3.
Reading latencies. Reading latency (msec) on single-word reading tests after (A) word level training in Week 1 and (B) story level training in Week 2. Latencies are reported for correct responses only and include words and nonwords. Both training groups improved in reading speed. FF participants improved at a similar rate as KF participants, although their average latency times were slower. The number of WPM was computed for reading performance on (C) the early reader training stories and (D) the standardized reading test stories. Graphs are consistent with single-word reading performance—the pattern of performance is similar between the two groups, although the FF group is slower.

